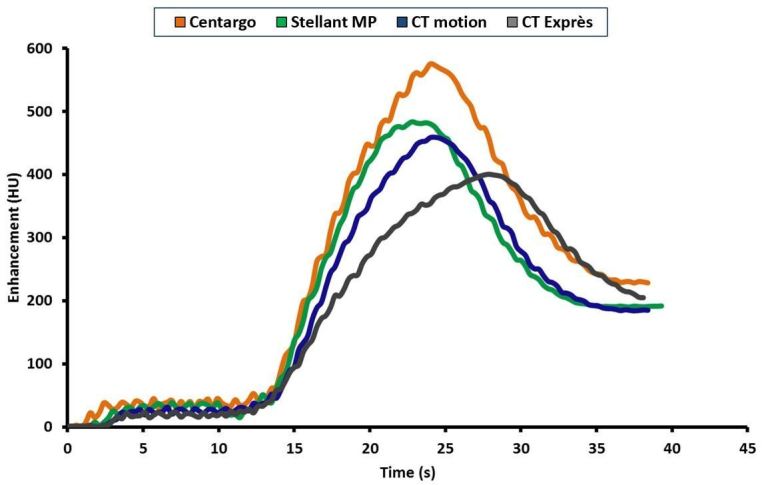
Figure 5.

Sample aortic enhancement comparison of injection systems with 2.0 gI/s programmed injection (time shifted based on contrast media arrival time): This figure represents the enhancement profile in the ascending aorta of the phantom when the same 2.0 gI/s injection is executed on each of the four injection systems. The impact of reduced achievable IDRs as the systems reduce flow to limit pressure is seen in the enhancement profiles and resulting peak enhancement values.
