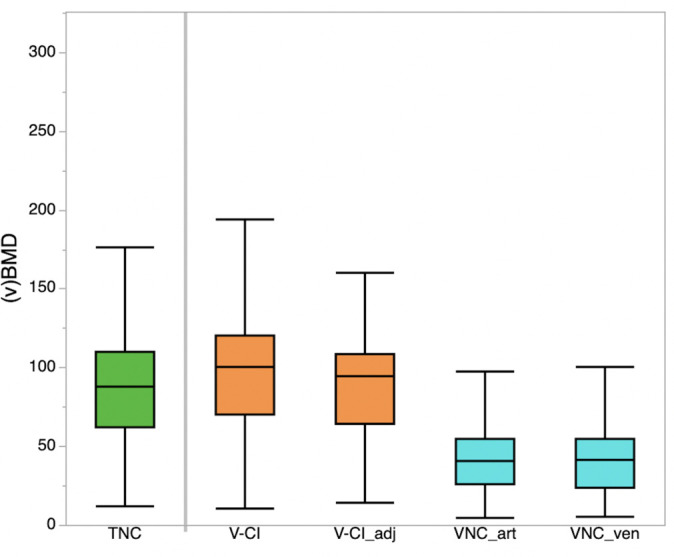
Figure 2.

Average volumetric bone mineral density values derived from TNC images, venous phase images (V-CI), V-CI with correction for contrast enhancement (V-CI_adj), and from VNC images of the arterial (VNC_art) and venous phase (VNC_ven). CI,conventional image; TNC, true non-contrast; VNC, virtual non-contrast.
