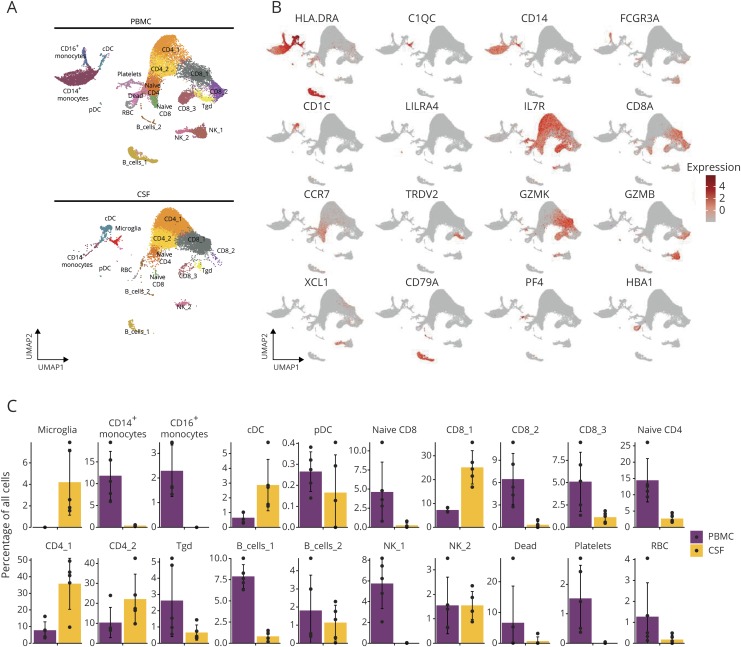
Figure 1. scRNA-seq characterization of leukocytes from MS, anti-MOG disorder, and HIV.
(A) UMAP of immune cell clusters from the blood (top) and CSF (bottom) of all subjects merged. (B) Characteristic marker gene expression assigned to each cluster displayed by UMAP. (C) Proportional abundance of 20 cell clusters within the blood (purple) and CSF (yellow). Y axis represents the percentage of all cells. cDC = conventional DC; PBMC = peripheral blood mononuclear cell; pDC = plasmacytoid DC; RBC = red blood cell; Tgd = γδ T cells; UMAP = Uniform Manifold Approximation and Projection.

