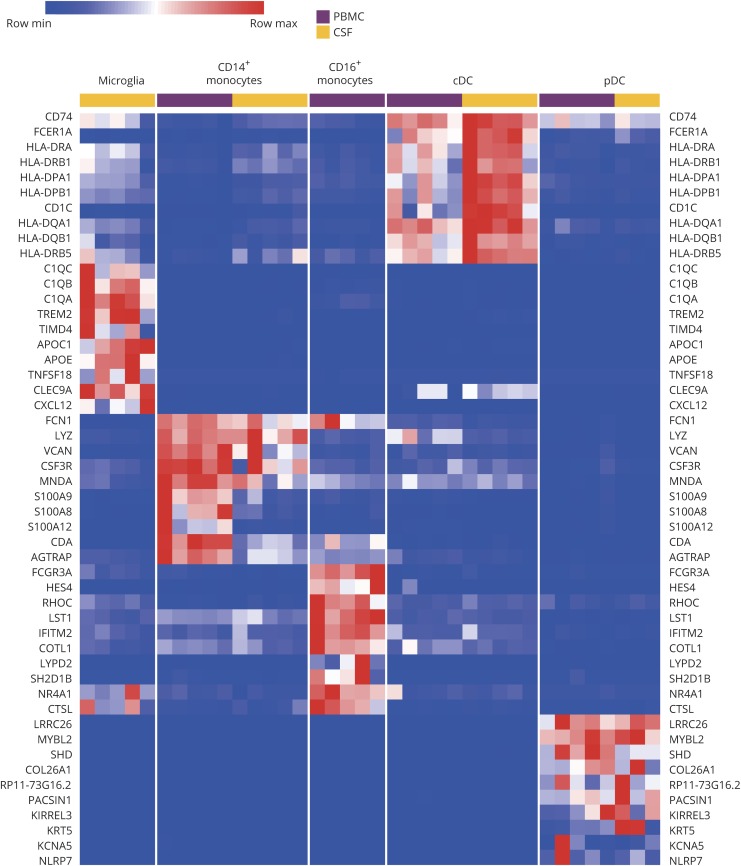
Figure 3. Discrimination of myeloid cell populations in neuroinflammation by gene expression.
Heatmap of 10 genes that discriminate myeloid cell types within the blood (purple) and CSF (yellow). Columns represent individual subjects. cDC = conventional DC; PBMC = peripheral blood mononuclear cell; pDC = plasmacytoid DC.

