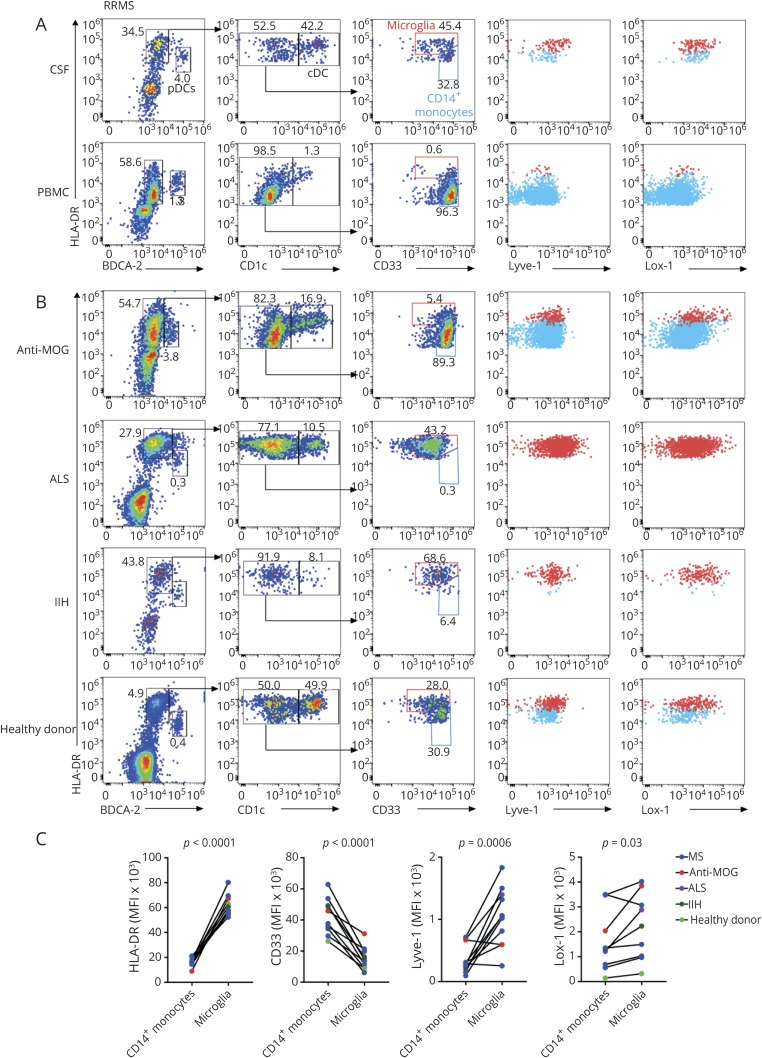
Figure 4. Flow cytometric identification of microglia and myeloid cells within the blood and CSF.
(A and B) Plots were obtained by gating on CD3−CD19− singlets. HLA-DR+BDCA-2hi cells represent pDCs. cDCs are represented as HLA-DR+BDCA-2−CD1chi. Red gates in the third column represent microglia, whereas blue gates represent monocytes. The fourth column shows HLA-DR and Lyve-1 staining of microglia (red) and monocytes (blue). The fifth column shows HLA-DR and Lox-1 staining of microglia (red) and monocytes (blue). (A) Flow cytometry on CSF and blood samples from a subject with RRMS. (B) Flow cytometry on CSF from subjects with anti-MOG disorder (anti-MOG), ALS, IIH, and a healthy control. (C) Mean fluorescence intensity (MFI) of HLA-DR, CD33, Lyve-1, and Lox-1 of CSF monocytes and microglia from subjects. Each pair of connected circles represents one CSF sample. Statistical significance was determined using a paired Student t test. ALS = amyotrophic lateral sclerosis; cDC = conventional DC; IIH = idiopathic intracranial hypertension; MOG = myelin oligodendrocyte glycoprotein; PBMC = peripheral blood mononuclear cell; pDC = plasmacytoid DC.

