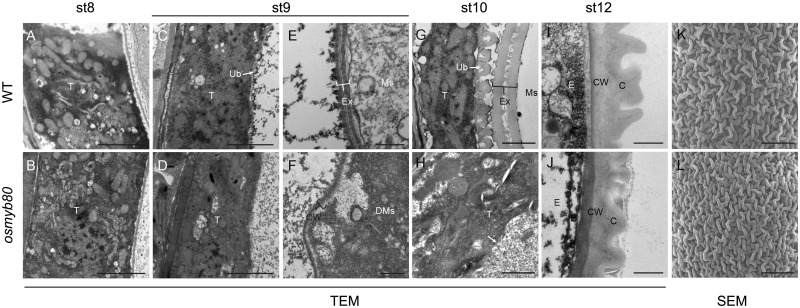
Fig. 4.
TEM and SEM analyses of the WT and osmyb80 anthers. The transverse sections of the WT (A, C, E, G, I) and osmyb80 (B, D, F, H, J) anthers at stage 8 (A, B), stage 9 (C–F), stage 10 (G, H) and stage 12 (I, J) are compared. (K, L) SEM observation of the WT and osmyb80 anther epidermis. Scale bars: (A–D, G, H) 1 μm; (E, F, I, J) 500 nm; and (K, L) 10 μm.

