Fig. 5.
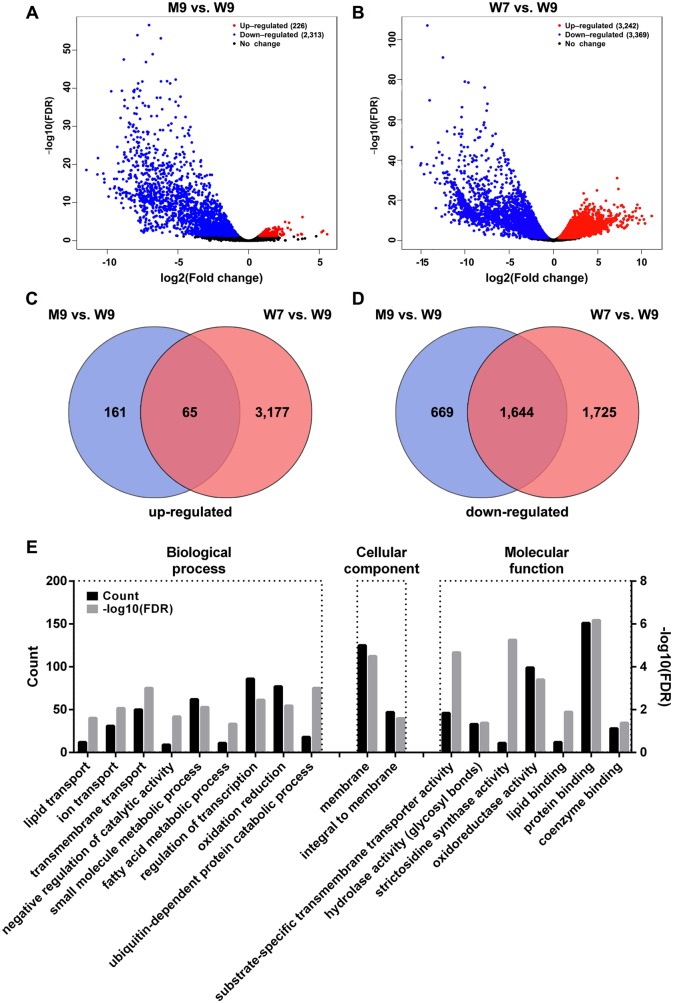
Identification of OsMYB80-related DEGs. (A) Volcano plot of DEGs between the osmyb80 and WT anthers at stage 9 (M9 vs. W9). (B) Volcano plot of DEGs between WT anthers at stages 7 and 9 (W7 vs. W9). Red dots and blue dots represent significantly up- and downregulated genes, respectively. Black dots represent no-change genes. (C) Overlap of upregulated genes identified in (A) and (B). (D) Overlap of downregulated genes identified in (A) and (B). (E) Significantly enriched GO analysis of OsMYB80-related DEGs. The count of genes (left y-axis) and −log10(FDR) (right y-axis) were shown for each enriched GO term.

