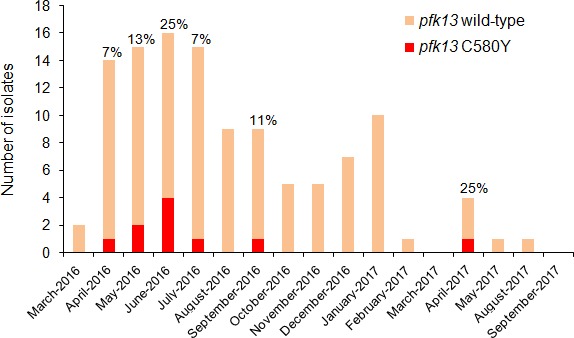
Figure 3. Temporal distribution of pfk13 C580Y mutants in Region 1 of Guyana per month of collection, 2016–2017.

The percentage of pfk13 C580Y mutants for each month of identification is represented above each bar.

The percentage of pfk13 C580Y mutants for each month of identification is represented above each bar.