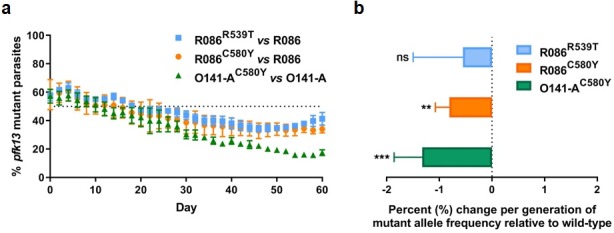
Figure 5. Competition growth assays of pfk13 mutant and wild-type parasites.
(a) Frequency of wild-type and mutant parasites in co-culture, as measured by TaqMan allelic discrimination qPCR. Data show the percentage of pfk13 mutant parasites in the culture over 60 days with sampling every two days. Error bars represent the SEM of pfk13 mutant allele frequency between the two biological replicates (including two technical replicates for qPCR). A percentage below 50% indicates the mutant was less fit than the isogenic pfk13 wild-type line. (b) Percentage change per generation of pfk13 mutant allele frequency relative to wild-type. Data show that pfk13 mutations confer an in vitro fitness cost in both parasite lines. Differences in growth rates were calculated as the percent change in pfk13 mutant allele frequency averaged over 30 generations. Error bars represent the SEM of percentage growth change between the two biological sampling experiments calculated for every generation in each co-culture. Significance was calculated using the Wilcoxon signed-rank test in every generation across the two biological replicate experiments. **p<0.01, ***p<0.001; ns: not significant.

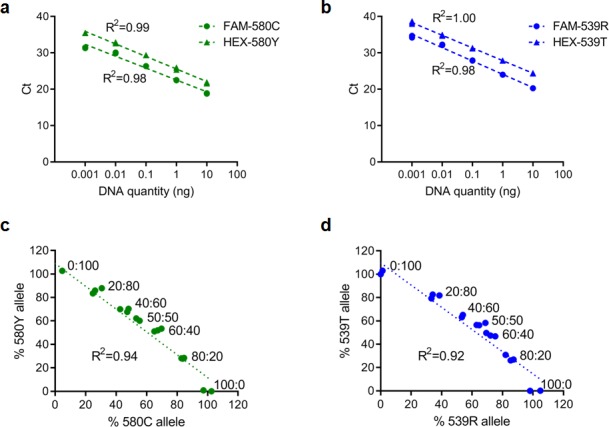
Figure 5—figure supplement 1. Representative standard curves for qPCR reactions targeting pfk13 C580/C580Y or pfk13 R539/R539T allele.


