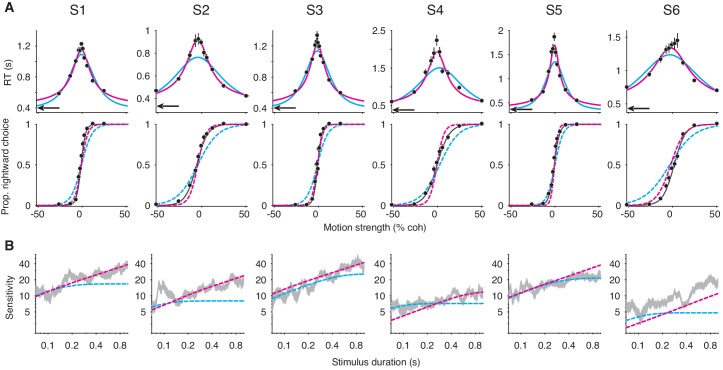
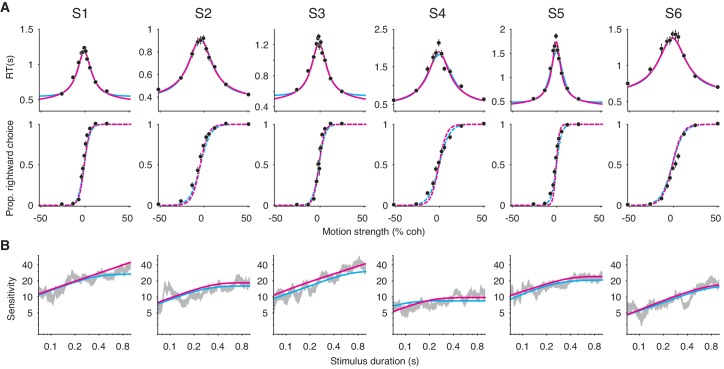
Figure 6. Failure of the extrema detection model and mixed success of the integration model in human subjects performing the RDM task.
(A) Free response (FR) trials. Reaction times (top) and proportion of rightward choices (bottom) as a function of motion strength for six human subjects (error bars are s.e.; ~1800 trials per subject). Positive (negative) motion coherence corresponds to rightward (leftward) motion. The arrows (top) indicate each subject’s estimated non-decision time from the speeded decision trials. Solid curves are model fits to the mean RTs (integration, magenta; extrema detection, cyan). Dashed curves are model predictions using the parameters obtained from the RT fits. Solid black lines (bottom) are fits of a logistic function to the choice-data alone. For visualization purposes, data from the interleaved 100% coherence trials are not shown (see Figure 6—figure supplement 1). (B) Variable stimulus duration (VSD) trials (~3000 trials per subject). Sensitivity as a function of stimulus duration for the same subjects as in (A). Sensitivity is estimated using logistic regression (sliding logarithmic time window, see Materials and methods). Dashed curves are model fits to the VSD data, using the κ parameter derived from model fits to the FR data.
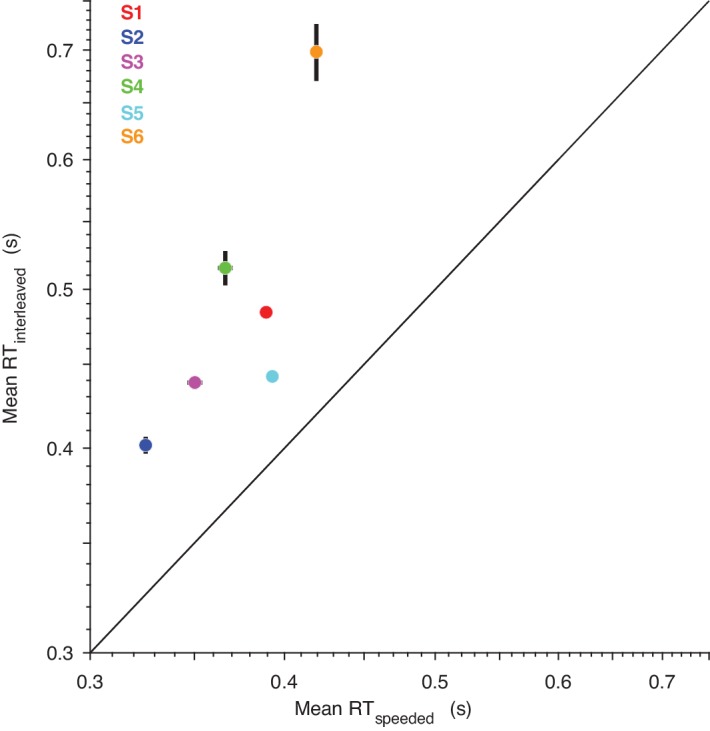
Figure 6—figure supplement 1. The reaction times from the ‘speeded decision’ experiment provide a better estimate of the non-decision time than those from the interleaved, 100% coherence trials.


