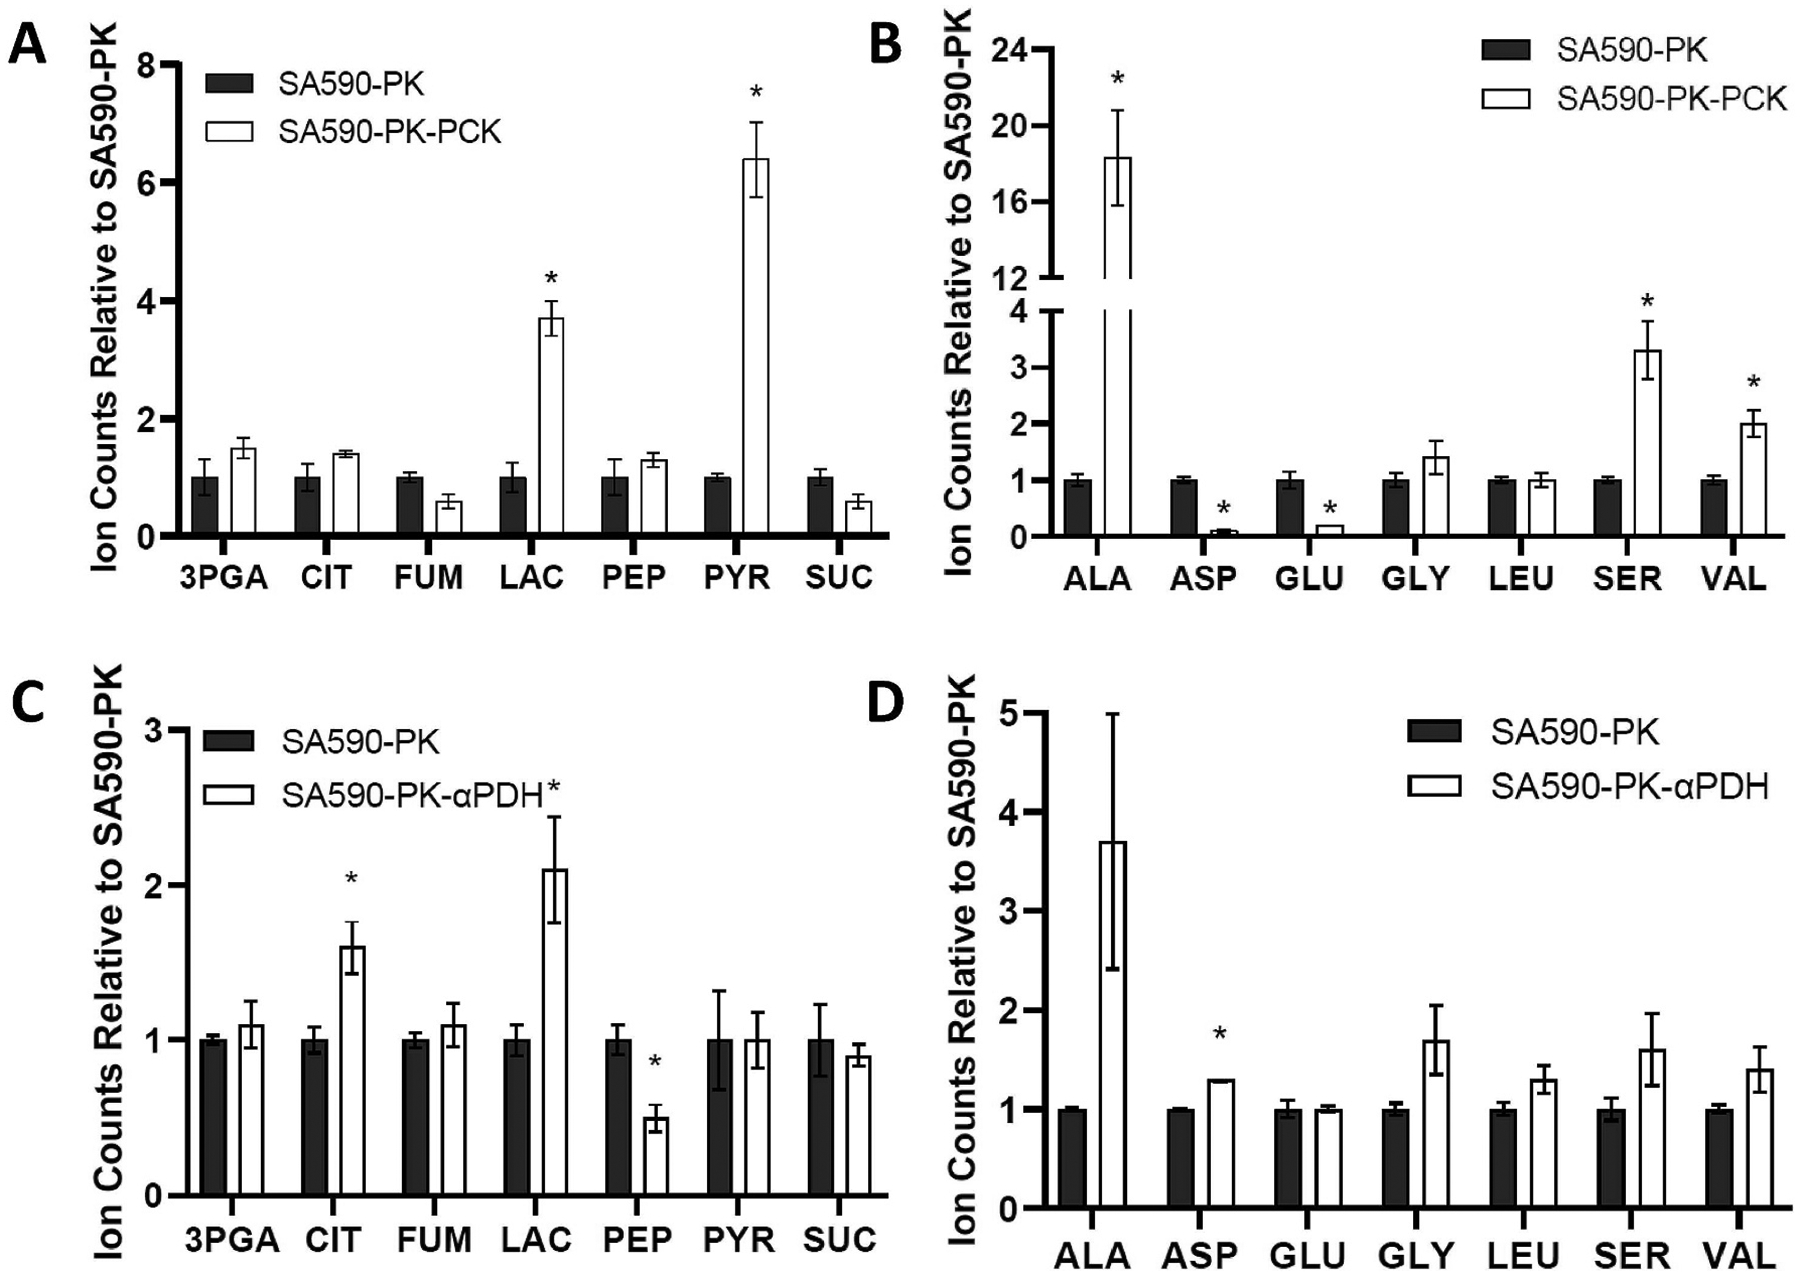
Fig. 7. Relative abundance of intracellular metabolites in SA590-PK-PCK and SA590-PK-αPDH.

(A) CBB cycle and TCA cycle metabolites, and (B) amino acids in SA590-PK-PCK relative to SA590-PK. (C) CBB cycle and TCA cycle metabolites, and (D) amino acids in SA590-PK-αPDH relative to SA590-PK. Data shown are GC-MS ion counts normalized to an internal standard, L-norvaline, and also normalized to cell density at the time of sample collection. The normalized ion counts for both strains were then expressed relative to SA590-PK, which adjusts all relative counts for SA590-PK to unity. Data ± SEM; n = 3. *p < 0.05 relative to control SA590-PK strain.
