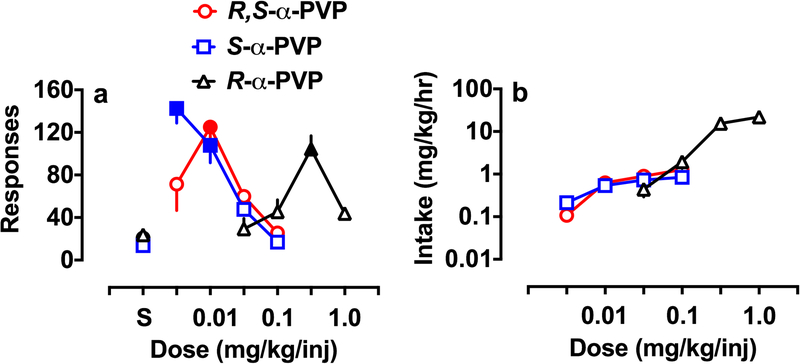
Fig.. 4.
Dose-effect functions for active responses (a) and mg/kg/hr intake (b) for racemic α-PVP and the enantiomers. Each rat was tested for 3 days at each dose with the final 2 days averaged for presentation and analysis. The point above S is the average for the last 2 days of extinction. Solid symbols for the response function are significantly different from the respective saline (p < 0.05). See text for description of statistics for intake. Each point is the mean ± SEM of 6–8 rats/group.

