
Figure 6: Immunohistochemistry detects differences between biopsies at baseline and end of study.
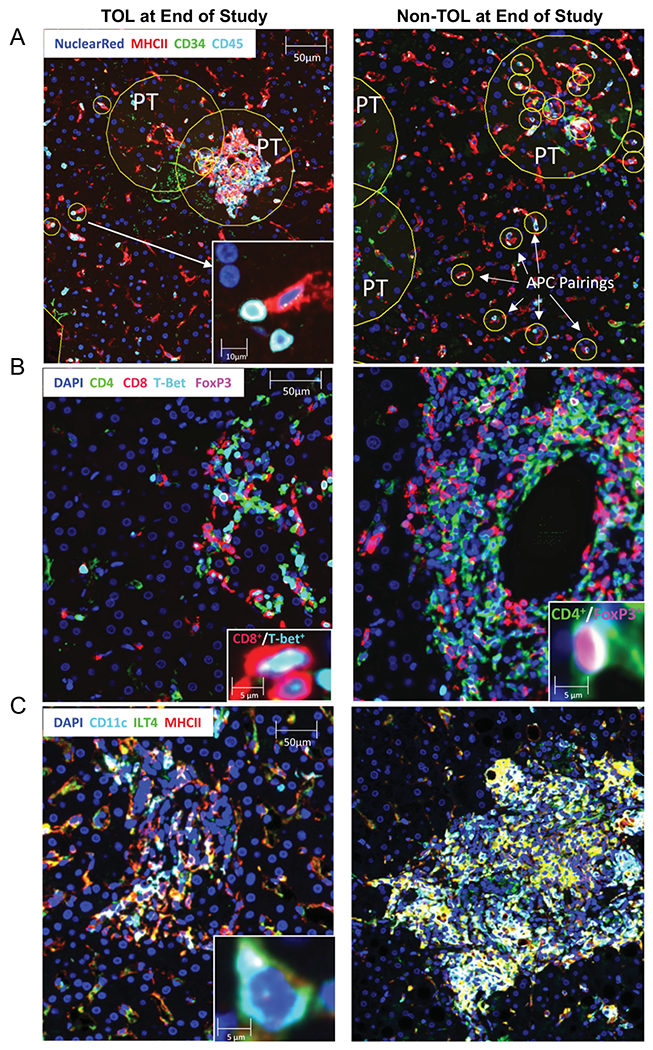
Biopsies were obtained from TOL and non-TOL participants at baseline and end of study. P values and n values for each stain/group combination can be found in Supplemental Table 8. Panels show representative images from end of study biopsies for TOL (left column) and non-TOL (right column) participants stained for APC:lymphocyte pairings (Panel A: in yellow circles; PT = portal tract), Foxp3+ and T-bet+ T cells (Panel B), and MHCII+CD11c+ILT4+ DC (Panel C). Main image bar = 50 μm, inset image bar = 10 μm or 5μm as indicated.