Fig. 3.

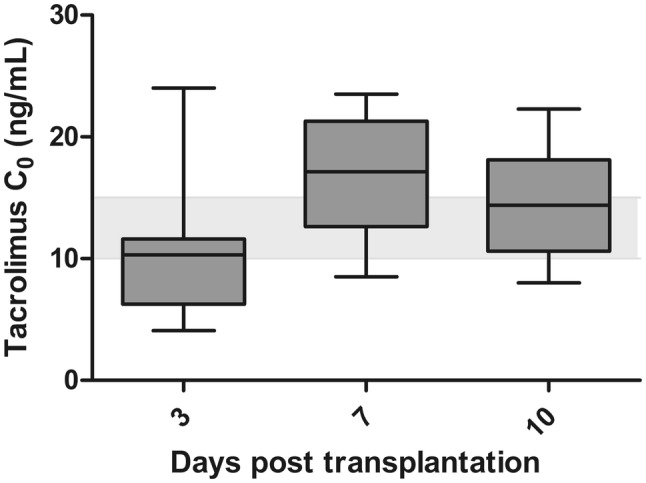
Boxplot depicting the tacrolimus pre-dose concentrations (C0) on days 3, 7, and 10 following transplantation. In this figure, the three patients who had a dose reduction before day 3 are excluded

Boxplot depicting the tacrolimus pre-dose concentrations (C0) on days 3, 7, and 10 following transplantation. In this figure, the three patients who had a dose reduction before day 3 are excluded