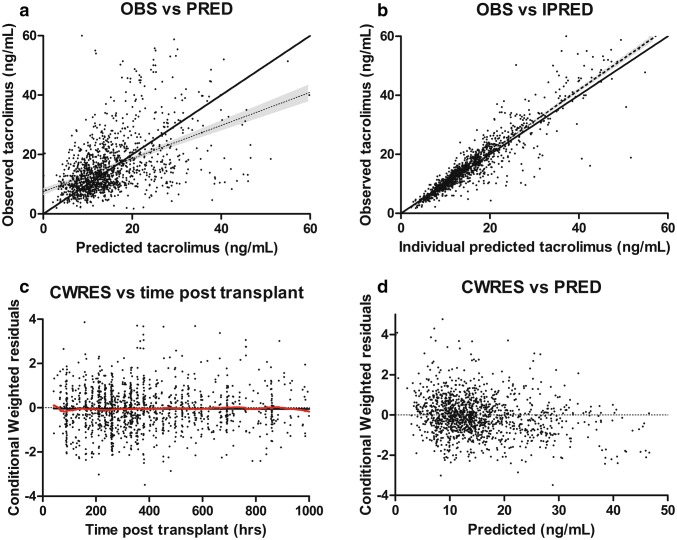
Fig. 4.
Goodness-of-fit plots of the final model. a Observed concentrations (OBS) DV plotted against predicted concentration (PRED). b DV plotted against individual predicted concentration (IPRED). c The correlation of conditional weighted residuals (CWRES) with the time after the tacrolimus dose. d The correlation of CWRES with PRED. The line represents the line of identity. DV dependent variable (measured concentration)

