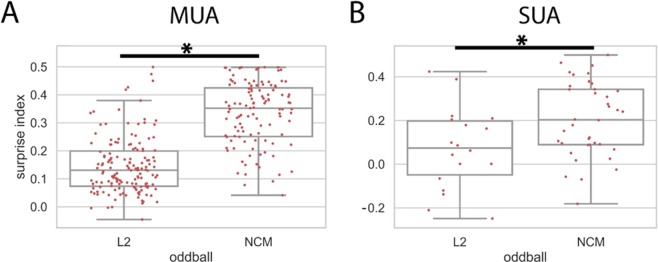
Figure 3.
Surprise index (SI) in Field L2 and NCM at jittered inter-stimulus intervals (ISI). (A) Multi-unit activity (MUA). Each dot represents SI from one recording site. The SI was significantly larger than 0 in both L2 and NCM and was significantly larger in NCM than in L2. The box shows the quartiles of the dataset while the whiskers extend to the rest of the distribution, except for a few potential outliers. A horizontal line with a star indicates that a comparison is significant. (B) Single-unit activity (SUA). The SI in NCM was significantly larger than 0 and larger than that in L2. Note that SIs were compared across different units using the independent sample t-test because single-units cannot be held across different recording conditions (see Methods). Note that y-axis has different scales in MUA and SUA.

