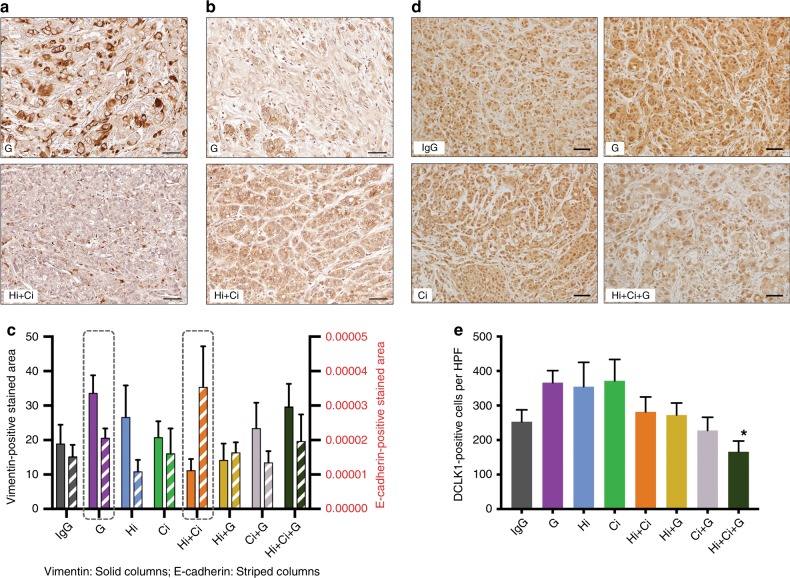
Fig. 4. Effects of HGF/c-MET inhibition ± gemcitabine on cancer cell EMT and cancer stemness.
a Representative photomicrographs of immunostaining for vimentin (dark brown) of G (gemcitabine) and Hi + Ci (inhibition of HGF and c-MET) groups. The full panel of representative images is allocated in Supplementary Fig. 4A. Scale bars = 50 µm. The negative control for vimentin staining is shown in Supplementary Fig. 8d. b Representative photomicrographs of immunostaining for E-cadherin (brown cell membrane staining) of G (gemcitabine) and Hi + Ci (inhibition of HGF and c-MET) groups. The full panel of representative images is allocated in Supplementary Fig. 4B. Scale bars = 50 µm. The negative control for E-cadherin staining is shown in Supplementary Fig. 8e. c Effects of HGF/c-MET inhibition ± gemcitabine on cancer cell EMT. The general pattern of vimentin and E-cadherin expression was that vimentin was higher than E-cadherin, except for the Hi + Ci Group (HGF-neutralising antibody + c-MET inhibitor). Comparing the expression for these two markers in the gemcitabine (G) and the HGF-neutralising antibody + c-MET inhibitor (Hi + Ci)-treated groups (highlighted by the dashed rectangles), it was observed that the expression of vimentin was high in G, but low in Hi + Ci. In contrast, E-cadherin expression was low in G, but high in Hi + Ci group. These data suggest that gemcitabine alone induces EMT, while inhibition of both HGF and c-MET protects from EMT. n = 6 mice per group. d Representative photomicrographs of immunostaining for DCLK1 (stem cell marker) of IgG, G (gemcitabine), Ci (c-MET inhibitor) and Hi + Ci (Inhibition of HGF and c-MET) groups. The full panel of representative images is allocated in Supplementary Fig. 5. Scale bars = 50 µm. The negative control for DCLK1 staining is shown in Supplementary Fig. 8f. e Effects of HGF/c-MET inhibition ± gemcitabine on cancer stemness. Triple therapy (Hi + Ci + G) significantly reduced DCLK1 expression in tumours compared to that in the gemcitabine (G) and c-MET inhibitor (Ci) treated groups. *p < 0.05, n = 6 mice per group.

