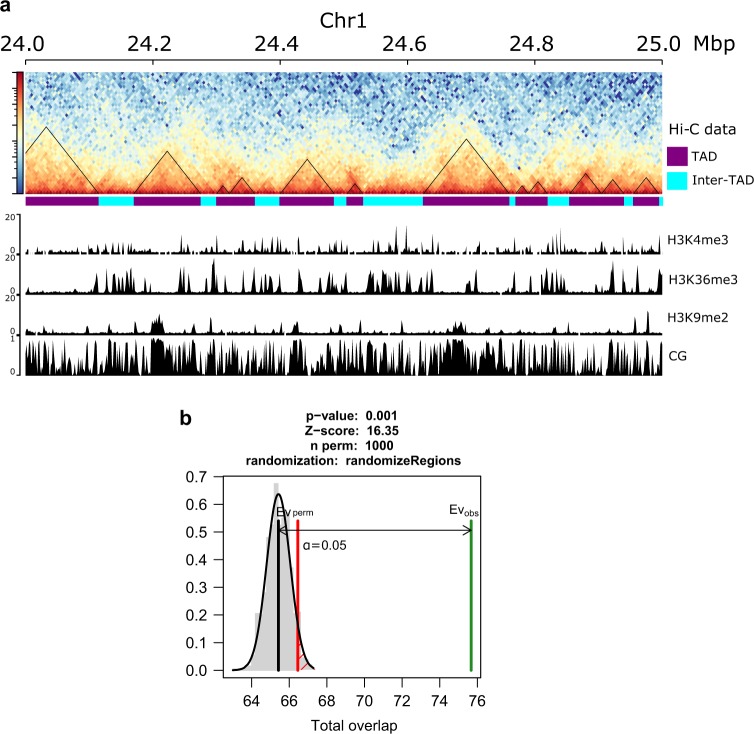
Fig. 1. Distribution of TADs across the rice genome.
a Contact maps showing TADs across a section of rice chromosome 1. TADs identified as regions of high chromatin interactions by Armatus are outlined by black triangles. The remaining regions are inter-TADs. Tracks below Hi-C data present selected epigenetic modifications in TAD and inter-TAD regions. b Overlap between TADs called by Armatus in this study and those identified by Liu et al.7 Both sets of TADs overlap much more than it would be expected by chance alone. Green line—observed overlap, grey line—mean of simulated overlap, red line—significance threshold. TADs: n = 4599, inter-TADs: n = 3346.

