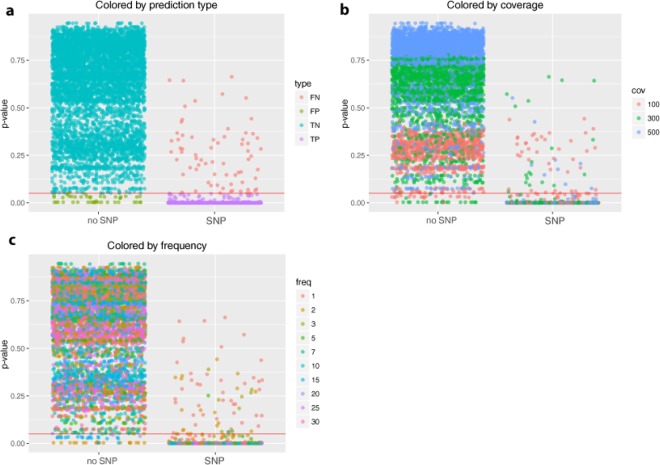
Figure 3.
p-value distribution of in-silico dataset positions. Scatterplot of calculated p-values for all positions with at least one alternative allele (n = 6870) divided by the status no SNP (n = 5955)/SNP (n = 915). The red line marks the critical p-value of 5%. (a) SNPs colored by the prediction type. FN – false negative, FP – false positive, TN – true negative and TP – true positive. The majority of positions was correctly classified, only 44 positions were false positive and 69 were false negative. (b) Colored by the theoretical coverage observed at a position; 56% of the wrongly classified positions had 100x coverage. (c) Colored by the theoretical frequency of the alternative allele at a position. Only positions with less than 5% frequency were wrongly classified.

