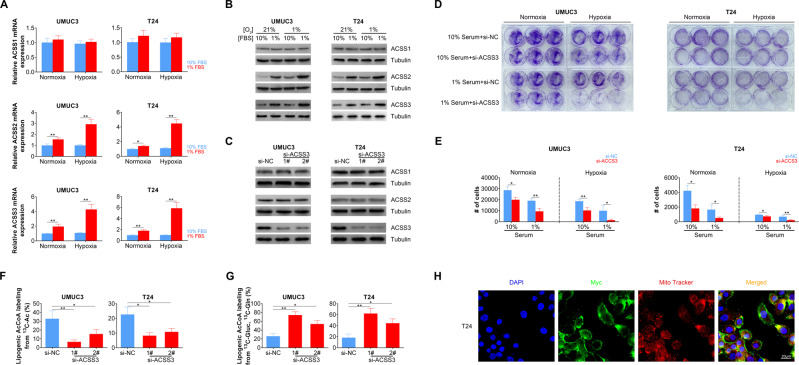
Fig. 2. ACSS3 is induced under metabolic stress and facilitate BLCA cell growth.
a ACSS1, ACSS2, and ACSS3 mRNA expression levels in BLCA cells under normoxia (21% O2) or hypoxia (1% O2) culture with 10% or 1% serum levels. b ACSS1, ACSS2, and ACSS3 protein expression levels in BLCA cells under normoxia (21% O2) or hypoxia (1% O2) culture with 10% or 1% serum levels. c ACSS1, ACSS2, and ACSS3 protein expression levels in BLCA cells transfected with control of ACSS3 siRNA. d Colony formed from BLCA cells transfected with control of ACSS3 siRNA under indicated culture situations. e Cell number of BLCA cells transfected with control of ACSS3 siRNA under indicated culture situations after 48 h incubation. f Percentage of lipogenic AcCoA generation from acetate (labeled by 13C) in BLCA cells transfected with control of ACSS3 siRNA under hypoxia (1% O2) culture. g Percentage of lipogenic AcCoA generation from glutamine or glucose (labeled by 13C) in BLCA cells transfected with control of ACSS3 siRNA under hypoxia (1% O2) culture. h Subcellular localization of ACSS3-Myc expressed in T24 cells. ACSS3 was detected with anti-myc antibody. Mitochondria was stained with MitoTracker.

