
Fig. 1. Kaplan–Meier plot of progression-free survival in enrolled patients (n = 30).
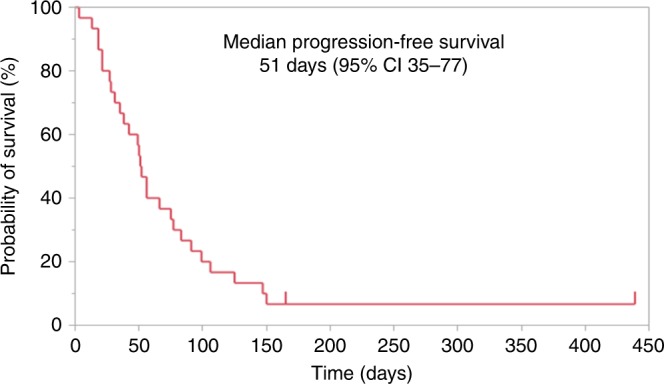
Marks on the curve indicate patients who were censored. The horizontal axis indicates progression-free survival (PFS), and the vertical axis indicates the rate of PFS. PFS was defined as the time since study enrolment to progressive disease (PD) or death from any reason. Median PFS is 51 days (95% CI 35–77 days).