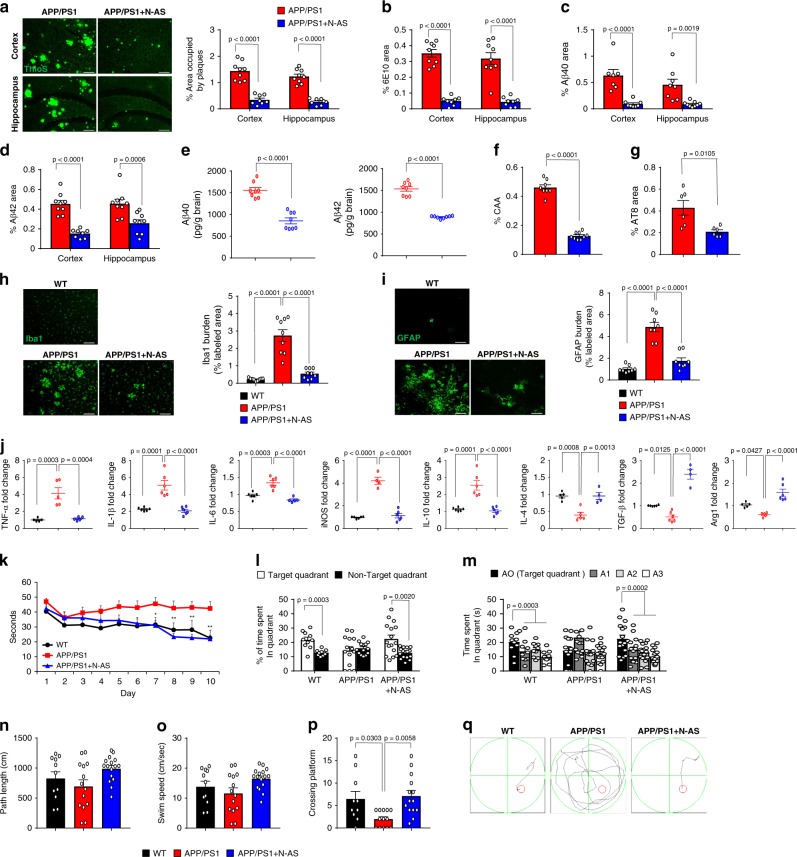
Fig. 6. Administration of N-AS reduces amyloid pathology and restores cognitive function in APP/PS1 mice by N-AS-triggered SPMs.
a Left, representative immunofluorescence images of thioflavin S (ThoS, Aβ plaques) in cortex and hippocampus of APP/PS1 and APP/PS1 treated with N-AS mice. Scale bars, 100 μm. Right quantification of area occupied by Aβ plaques (APP/PS1 mice, n = 9; APP/PS1 + N-AS mice, n = 8). b Quantification of 6E10 in cortex and hippocampus of APP/PS1 and APP/PS1 treated with N-AS mice (n = 8–9 mice per group). c–e Analysis of Aβ40 and Aβ42 depositions from the mice brain samples of the APP/PS1 and APP/PS1 treated with N-AS mice using immunofluorescence staining (c, d n = 7–9 mice per group) and ELISA kits (e n = 8 mice per group). f, g Quantification of amyloid angiopathy (f n = 8–9 mice per group, CAA) and tau hyperphosphorylation (g n = 6 mice per group, AT8) in cortex of APP/PS1 and APP/PS1 treated with N-AS mice. h Left, immunofluorescence images of microglia (Iba1) in cortex of WT, APP/PS1, and APP/PS1 treated with N-AS mice brain. Scale bars, 100 μm. Right, quantification of Iba1+ microglia in WT, APP/PS1, and APP/PS1 treated with N-AS (n = 9 mice per group). i Left, immunofluorescence images of astrocyte (GFAP) in cortex of WT, APP/PS1, and APP/PS1 treated with N-AS mice brain. Scale bars, 100 μm. Right, quantification of GFAP+ astrocyte in WT, APP/PS1, and APP/PS1 treated with N-AS (n = 8 mice per group). j mRNA levels of inflammatory markers in cortex of WT, APP/PS1, and APP/PS1 treated with N-AS mice brain (n = 4–6 per group). Pro-inflammatory marker: TNF-α, IL-1β, IL-6, and iNOS, Immunoregulatory cytokine: IL-10, Anti-inflammatory marker: IL-4, TGF-β, and Arg1. k Learning and memory was assessed by Morris water maze test in the WT (n = 10), APP/PS1 (n = 14), and APP/PS1 injected with N-AS (n = 16) mice. l–q At probe trial day 11 of Morris water maze test, time spent in target platform (l) and other quadrants (m) was measured. Path length (n) and swim speed (o) analyzed. p The number of times each animal entered the small target zone during the 60 s probe trial. q Representative swimming paths at day 10 of training. a–g, l Student’s t-test. h–k, m–p One-way analysis of variance, Tukey’s post hoc test. All error bars indicate s.e.m. Source data are provided as a Source data file.

