
Fig. 4. Right DLPFC tracks total but not relative uncertainty.
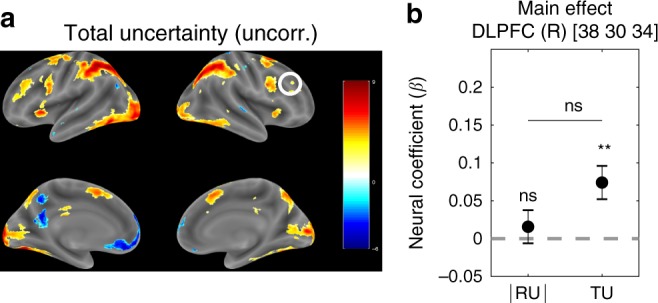
a Whole-brain TUt contrast from GLM 1. Single voxels were thresholded at p < 0.001. Multiple comparisons correction was not applied (corrected version is shown in Supplementary Fig. 7B). The color scale represents t-values across subjects. The circled ROI in right DLPFC (MNI [38 30 34]) from Badre et al.26 was used in the subsequent confirmatory analysis (10 mm sphere around the peak voxel). b Neural regression coefficients (betas) from GLM 1 for the parametric modulators ∣RUt∣ (β∣RU∣) and TUt (βTU) at trial onset. Error bars are cross-subject standard errors. Comparisons were made using Student’s t-tests. **p < 0.01, ns: not significant. Source data are provided as a Source Data file.