
Figure 6.
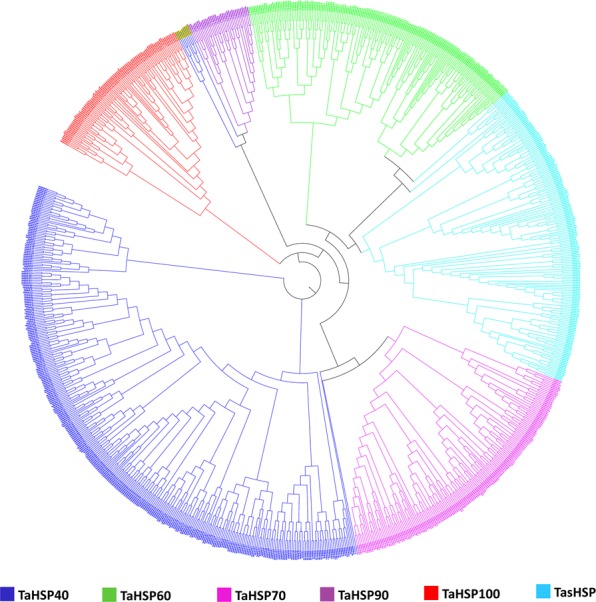
Phylogenetic relationship within HSP sub-families in wheat, inferred using maximum likelihood method. Different colors represent different sub-families within the HSP family.
Official websites use .gov
A
.gov website belongs to an official
government organization in the United States.
Secure .gov websites use HTTPS
A lock (
) or https:// means you've safely
connected to the .gov website. Share sensitive
information only on official, secure websites.
Phylogenetic relationship within HSP sub-families in wheat, inferred using maximum likelihood method. Different colors represent different sub-families within the HSP family.