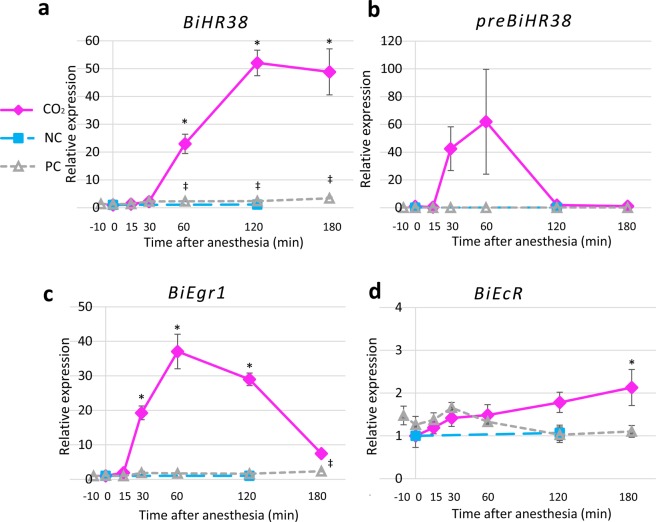
Figure 3.
Analysis of BiHR38, preBiHR38, BiEgr1, and BiEcR expression levels after seizure induction. Time-course of the expression after awakening from CO2 anesthesia of BiHR38 (a), preBiHR38 (b), BiEgr1 (c), and BiEcR (d). The expression level of each gene was analyzed by qRT-PCR and normalized with that of BiEF1α. Magenta lines indicate the group anesthetized with CO2 (“CO2”), light blue dashed lines indicate the negative control (“NC”, continuously anesthetized with CO2 for 120 min), and gray dotted lines indicate the positive control (“PC”, exposed just to air flow). All data indicate means ± SEM. Significant differences on the basis of Dunnett’s test after the ANOVA are indicated (*p < 0.05 for CO2 group, ‡p < 0.05 for PC group). Student’s t test and Welch’s t test revealed no significant difference between the NC group and the CO2 0-min group. Some errors were so low that it is difficult to see the error bars in the graph. n = 5 for each sample.

