Figure 4.
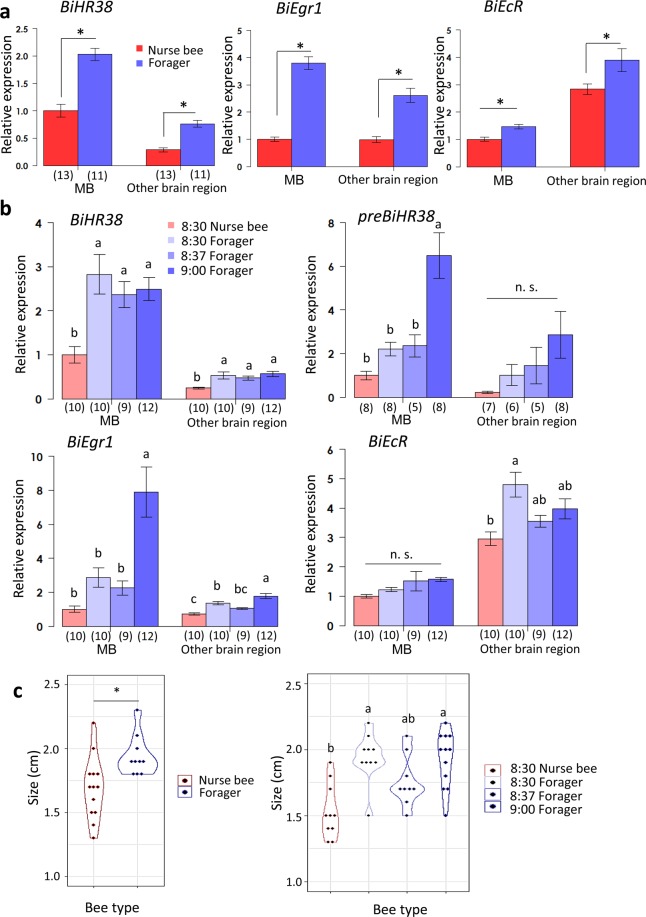
Analysis of BiHR38, preBiHR38, BiEgr1, and BiEcR expression during foraging flight by qRT-PCR. Expression analysis for the greenhouse experiment (a) and the laboratory flight-cage experiment (b). The expression level of each gene was analyzed by qRT-PCR and normalized with that of BiEF1α. Each bar represents the mean ± SEM. Significant differences are indicated by asterisks (p < 0.05, Student’s t test or Welch’s t test after the F test) on the error bars in (a), or different letters (p < 0.05, Tukey-Kramer test in (b), respectively). The sample size is indicated by the number in parentheses below the horizontal axis. (c) The body sizes of B. ignitus workers captured in the greenhouse (left) and those from the flight-cage (right). Significant differences are indicated by asterisks in the left panel (p < 0.05, Student’s t test), and different letters in the right panel (p < 0.05, Tukey-Kramer test) n.s., not significant.

