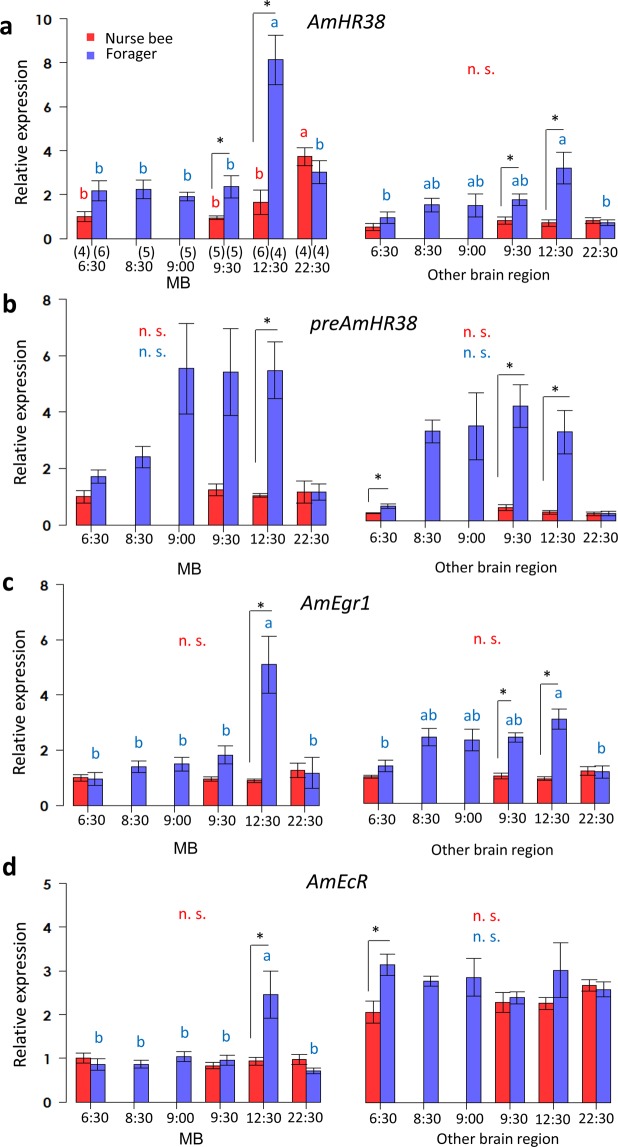
Figure 5.
Analysis of AmHR38, preAmHR38, AmEgr1, and AmEcR expression during foraging flight by qRT-PCR. Expression levels of AmHR38 (a), preAmHR38 (b), AmEgr1 (c), and AmEcR (d) were analyzed by qRT-PCR and normalized with that of AmEF1α. Each bar represents the mean ± SEM. Significant differences are indicated using different letters (p < 0.05, Tukey-Kramer test for nurse bees [red] and for foragers [blue] during the time-course, in each brain tissue respectively) or asterisks (p < 0.05, Student’s t test or Welch’s t test after the F test) on the error bars (black). The sample size is shown below the horizontal axis in parentheses. n.s., not significant.

