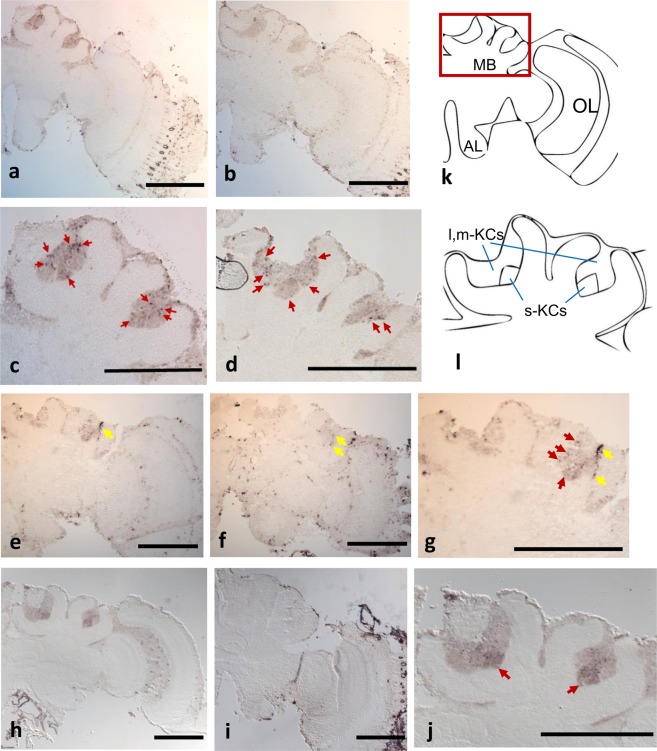
Figure 6.
In situ hybridization of BiHR38, BiEcR, and BiEgr1 in forager brain sections. Expression of BiHR38 (a–d), BiEgr1 (e–g), and BiEcR (h–j) was analyzed by in situ hybridization. Sections of brain hemispheres hybridized with antisense (a,e,h) or sense probes (b,f,i) are shown. Panel (k) indicates schematic drawing of the brain hemisphere and panel (l) indicates the magnified view of the MB enclosed by the red square in panel (k). Panels (c,d,g,j) indicate magnified views of the MB area in panels (a,e,h), respectively. (a–c) Forager collected at 9:00 in the laboratory flight-cage; (d–j) forager collected as “Forager” in the greenhouse. Representative signals are indicated by red arrows. Processing-induced damage to the tissue is indicated by yellow arrows (e–g, respectively). The s (m,l)-KCs: small-type (middle-, large-) Kenyon cells, AL: antennal lobe, OL: optic lobe. Scale bars = 500 µm.

