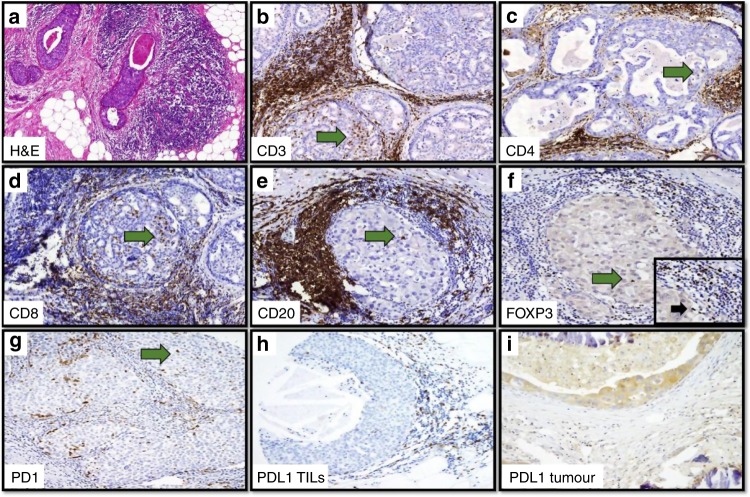
Fig. 1. Photomicrograph for immune cells and checkpoint proteins in DCIS.
a Dense Overall TILs infiltration in H&E stained sections (×20). Dense stromal and intratumoural infiltration of various immune cell markers, b CD3, c CD4, d CD8, e CD20, f FOXP3, g PD1 and h PDL1. Expression of PDL1 within the tumour epithelial cells is shown in (I). Green arrows highlight the intratumoural lymphocytes. Inset: higher magnification (×40) showing stromal FOXP3 positive cells.

