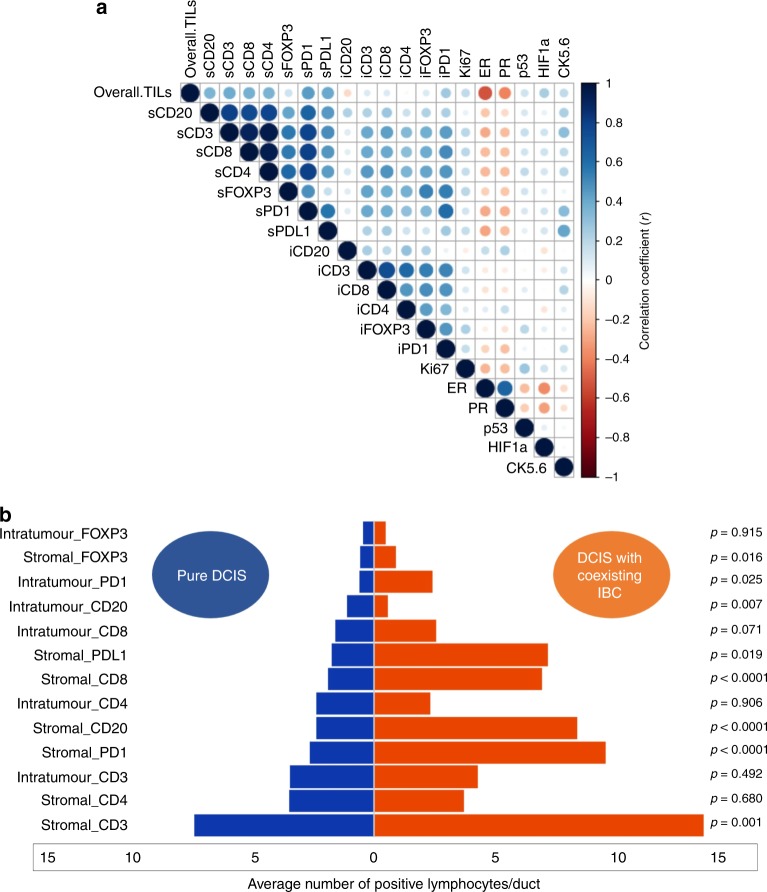
Fig. 2. Distribution of various TILs subtypes in pure and mixed DCIS cohorts.
a Correlation Matrix showing the correlation between TILs subtypes, overall TILs, and other associated biomarkers. (s stromal, i intratumoural). Blue colour refers to positive correlation, while the red colour reflects negative correlations. The intensity of the colour propionate to the correlation coefficient. b Tornado (Butterfly) plot showing the differential expression level of various lymphocytes between pure DCIS and DCIS mixed with synchronous invasive breast cancer (IBC).

