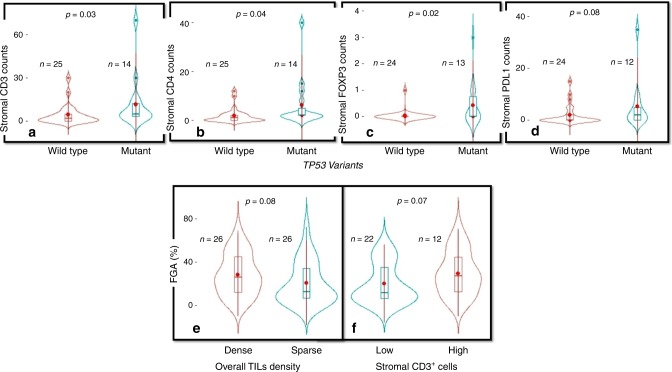
Fig. 3. Associations between TILs and underlying genomic changes.
Violin plots showing the association between TP53 variants and a stromal CD3+ cells, b stromal CD4+ cells, c stromal FOXP3+ cells and d stromal PDL1 + TILs. The lower figures show the association between fraction of genome altered and e overall TILs density and f stromal CD3+ cells. The central red dots represent the mean, boxes represent the interquartile range, central line represent the median and whiskers shows the 95% confidence interval.

