Figure 1.

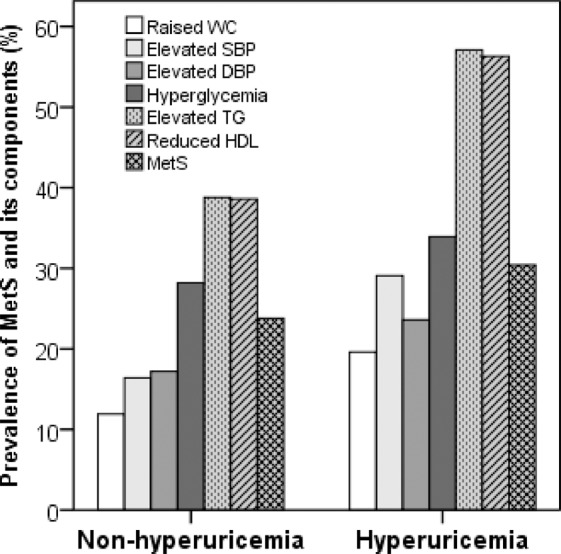
Prevalence of MetS and its components in the hyperuricemic and non-hyperuricemic group. P < 0.05 for all cases when the prevalence of MetS and its component are compared between the groups. P-values are obtained from the Chi-square test.

Prevalence of MetS and its components in the hyperuricemic and non-hyperuricemic group. P < 0.05 for all cases when the prevalence of MetS and its component are compared between the groups. P-values are obtained from the Chi-square test.