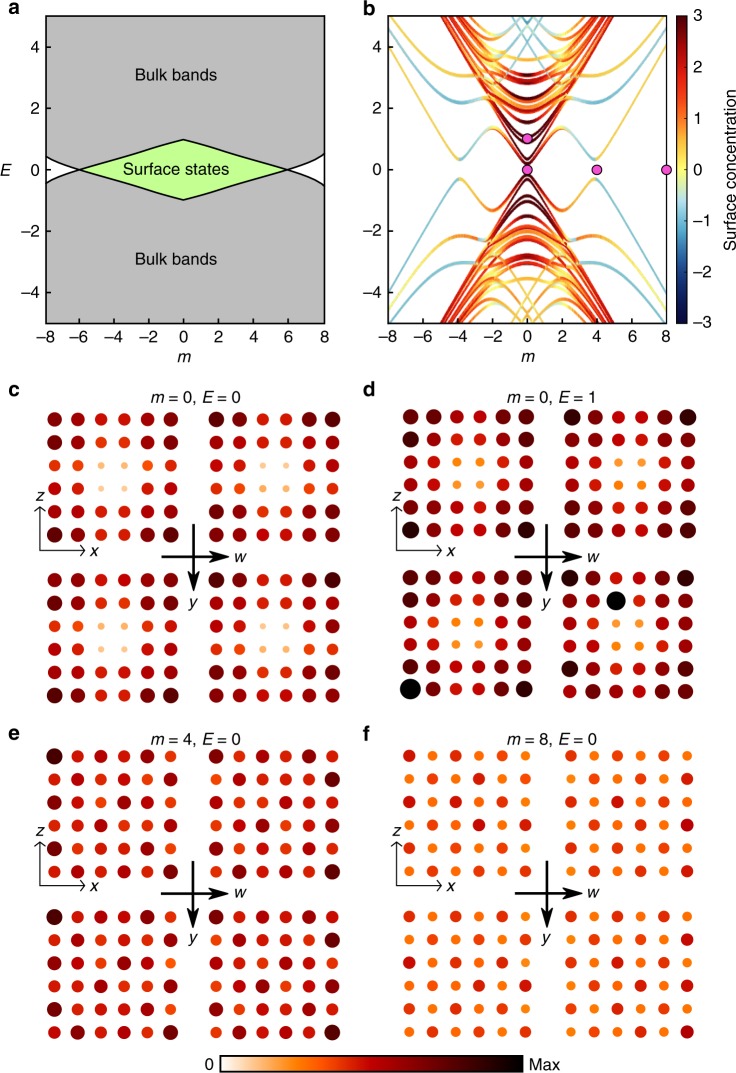
Fig. 2. Band diagram and local density of states of the 4D lattice.
a Calculated band diagram for the infinite 4D lattice. The bulk bands are shown in grey. For ∣m∣ < 6, there is a bandgap associated with nontrivial second Chern number, accompanied by topological surface states (shaded green). For ∣m∣ > 6, the bandgap is trivial. b Calculated band diagram for 144-site lattice with periodic boundary conditions along y and w. Colours indicate the degree of surface concentration of the energy states, as defined Eq. (5). Due to finite-size effects, surface states occur at ∣m∣ ≲ 2 and the gap closing is shifted to ∣m∣ ≈ 4. The parameters corresponding to subplots c–f are indicated with pink dots. c–f Experimentally-obtained LDOS maps for different m and E, measured at working frequency f = f0. Surface states are observed in c, d consistent with theoretical predictions.

