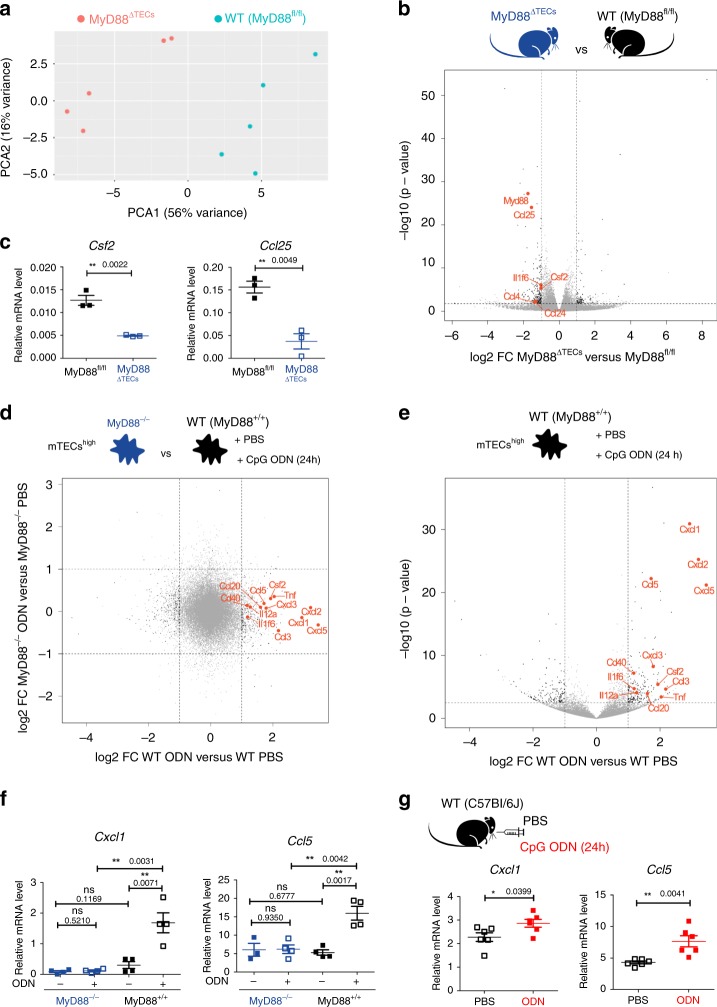
Fig. 2. TLR/MyD88 signaling in mTECshigh drives the expression of cytokines and chemokines.
a Principal component analysis of bulk RNA-sequencing data from mTECshigh (sorted as in Supplementary Fig. 1a) derived from MyD88fl/fl and MyD88ΔTECs mice. Data represents the analysis of n = 5 samples for each condition. b Volcano plot analysis of RNA-sequencing data described in a. Fold-change cutoff of log2 = ±1,0 and p-value: 0.05 are marked by dashed lines (also in d, e). Differentially expressed genes are depicted in black, genes of interest are in red, and other detected genes in grey. c qRT-PCR analysis of relative mRNA expression normalized to Casc3 of genes selected from b (mean ± SEM, n = 3 samples). d Fold-change fold-change plot of RNA-sequencing data from CpG ODN or PBS in vitro stimulated mTECshigh (sorted as in Supplementary Fig. 1a) from MyD88+/+ and MyD88–/– mice (n = 4 samples for each condition). Color code as in b. e Volcano plot analysis of RNA-sequencing data from d, comparing CpG ODN versus PBS in vitro stimulated mTECshigh from MyD88+/+ mice. Statistical analysis for b, d and e was performed by Wald test, p-value cutoff: 0.05. f, g qRT-PCR analysis of Cxcl1 and Ccl5 mRNA expression (normalized to Cacs3) from in vitro (mean ± SEM, n = 4 samples) and intrathymically (mean ± SEM, n = 6 mice), respectively, CpG ODN or PBS stimulated mTECshigh from indicated animals. Statistical analysis for c, f, and g was performed by unpaired, two-tailed Student’s t-test, p ≤ 0.05 = *, p ≤ 0.01 = **, ns not significant.

