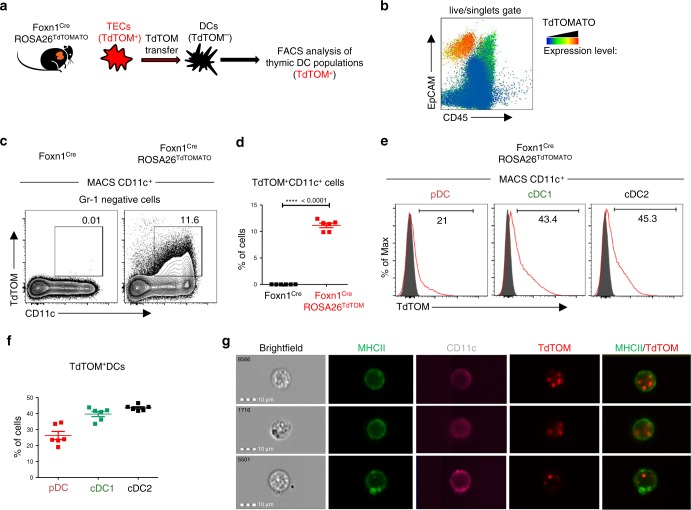
Fig. 4. Foxn1CreROSA26TdTOMATO as a model of thymic cooperative antigen transfer.
a Experimental design. b Flow cytometry heat-map analysis showing the intensity of TdTOM fluorescence among MACS TCRβ-depleted cells from the thymus of the Foxn1CreROSA26TdTOMATO mouse. c Representative flow cytometry plots comparing the frequency of TdTOM+CD11c+ cells in the thymic MACS-enriched CD11c+ cells between the WT (Foxn1Cre) and Foxn1CreROSA26TdTOM mouse. Cells were pre-gated as live, singlets, and Gr-1–. d Quantification of TdTOM+CD11c+ cells from c (mean ± SEM, n = 6 mice). Statistical analysis was performed by unpaired, two-tailed Student’s t-test, p < 0.0001 = ****. e Representative flow cytometry histograms showing the frequency of TdTOM+ cells among pDC, cDC1, and cDC2 (gated as in Supplementary Fig. 4a). Gray histograms = Foxn1Cre (control) mice, red histograms = Foxn1CreROSA26TdTOM mice. f Quantification of frequencies of TdTOM+ DCs among the indicated DC subsets (mean ± SEM, n = 6 mice). g Representative images from the Imagestream analysis showing intracellular localization of transferred TdTOM in MHCII+CD11c+ DCs from the thymus of Foxn1CreROSA26TdTOMATO (n = 400 measured cells).

