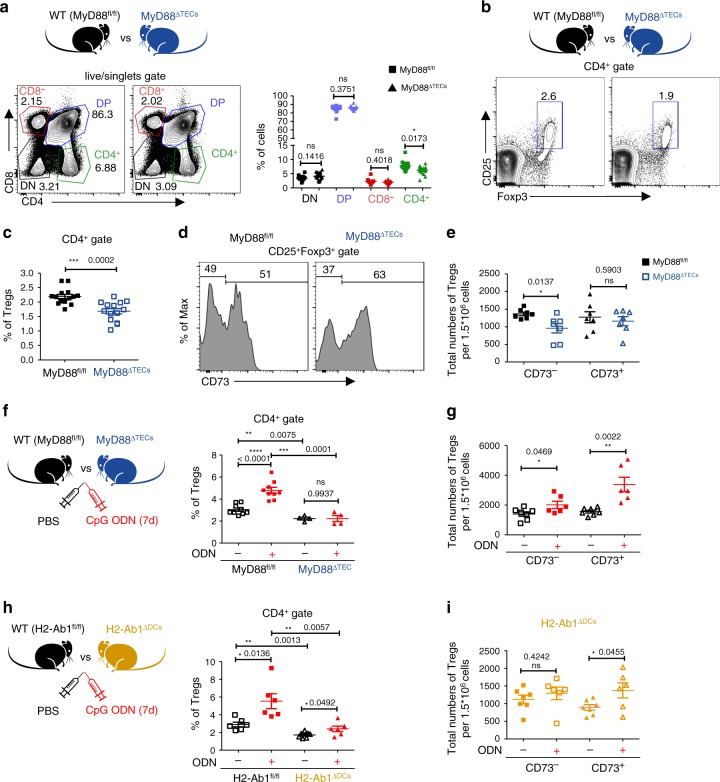
Fig. 6. Development of thymic Tregs is impaired in MyD88ΔTECs mice.
a Representative flow cytometry plots (left plot) and their quantification (right plot) comparing the frequencies of main thymic T cell populations between MyD88fl/fl and MyD88ΔTECs mice (mean ± SEM, n = 14 mice). b Representative flow cytometry plots comparing the frequencies of CD4+CD25+Foxp3+ thymic Tregs between MyD88fl/fl and MyD88ΔTECs mice. c Quantification of frequencies from b (mean ± SEM, n = 14 mice). d Representative flow cytometry histograms showing the expression of CD73 by CD4+CD25+Foxp3+ thymic Tregs (gated as in b). e Quantification of the total numbers of CD73– and CD73+ thymic Tregs from d (mean ± SEM, n = 7 mice). f Quantification of the frequencies of thymic Tregs from CpG ODN or PBS intrathymically stimulated (7 days) MyD88fl/fl or MyD88ΔTECs mice (mean ± SEM, n = 4 for MyD88ΔTECs and n = 9 for MyD88fl/fl mice). g Quantification of the total numbers of CD73– and CD73+ thymic Tregs from CpG ODN or PBS intrathymically stimulated (7 days) WT (C57Bl/6J) mice (mean ± SEM, n = 6 for ODN+ and n = 7 for ODN– mice). h Quantification of frequencies of thymic Tregs from CpG ODN or PBS intrathymically stimulated (7 days) H2-Ab1fl/fl or H2-Ab1fl/flItgaxCre (H2-Ab1ΔDCs) mice (mean ± SEM, n = 6 for H2-Ab1fl/fl and ODN+ H2-Ab1ΔDCs and n = 7 for ODN– H2-Ab1ΔDCs mice). i Quantification of the total numbers of CD73– and CD73+ thymic Tregs from CpG ODN or PBS intrathymically stimulated (7 days) H2-Ab1ΔDCs mice (mean ± SEM, n = 6 for ODN+ and n = 7 for ODN– mice). Statistical analysis in a, c, e–i was performed by unpaired, two-tailed Student’s t-test, p ≤ 0.05 = *, p ≤ 0.01 = **, p ≤ 0.001*** p < 0.0001****, ns not significant.

