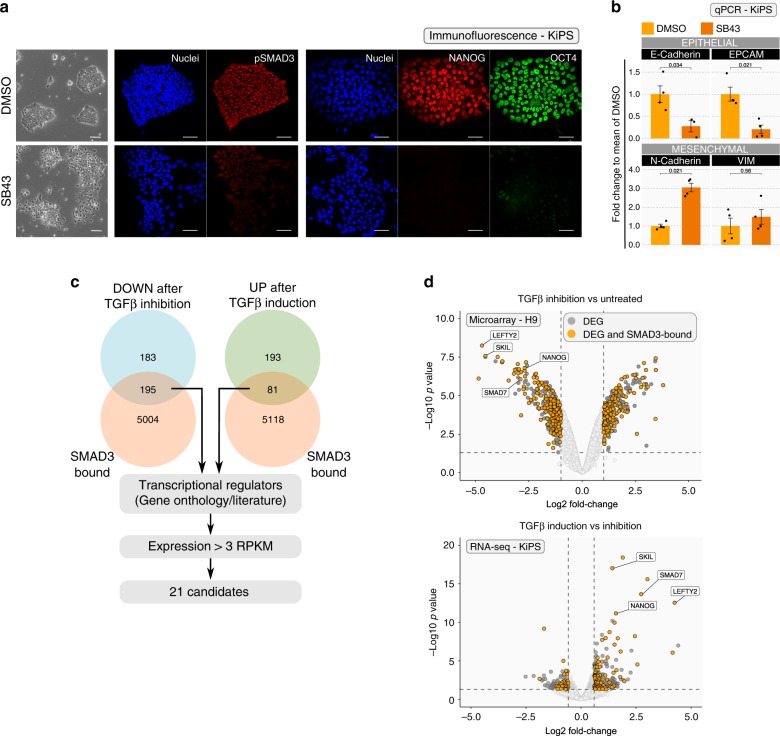
Fig. 1. Identification of TGF-beta/SMAD3 transcriptional targets in hPSCs.
a Left: Morphology of KiPS treated with SB43 (10 µM) or the vehicle DMSO for 5 days. Right: Immunostaining for phosphorylated SMAD3 (pSMAD3) and the pluripotency markers NANOG and POU5F1/OCT4 shows a reduction of these markers after 5 days of SB43 treatment. See also Supplementary Fig. 1c for additional markers. Representative images of four independent experiments for NANOG and POU5F1/OCT4 and two independent experiments for pSMAD3 are shown. Scale bars 50 µm. b Gene-expression analysis by qPCR of KiPS treated with SB43 or DMSO for 5 days. Bars indicate the mean ± SEM (standard error of the mean) of four independent experiments shown as dots. Expression was normalised to the mean of DMSO samples. Unpaired two-tailed Mann–Whitney U test. Source data are provided as a Source Data file. c Approach used to identify potential SMAD3 direct targets. See also Supplementary Fig. 1e. d Top: Transcriptome analysis of hESCs treated with SB43 for 48 h (microarray data from ref. 10). Dark grey dots indicate differentially expressed genes (DEGs) for −1 > Log2 fold-change > 1 and p-value < 0.05. Orange dots refer to DEGs bound by SMAD3 (data from ref. 15), max distance between peak midpoint and TSS: ±50 kb. p-values were calculated with limma (v3.18.13)64 and were adjusted for multiple testing with Benjamini–Hochberg correction. Bottom: Transcriptome analysis of hiPSCs treated for 4 h with mTeSR after 16 h of SB43 treatment (RNA-seq data, in this study). Dark grey dots indicate DEGs for −0.585 > Log2 fold-change > 0.585 (corresponding to an increase of 50%) and p-value < 0.05. Orange dots refer to DEGs bound by SMAD3. Known SMAD3 targets, such as NANOG, LEFTY2, SKIL and SMAD7 serve as positive controls10,11,13. p-values were calculated with edgeR package (v3.4.2)60 and were adjusted for multiple testing with Benjamini–Hochberg correction.

