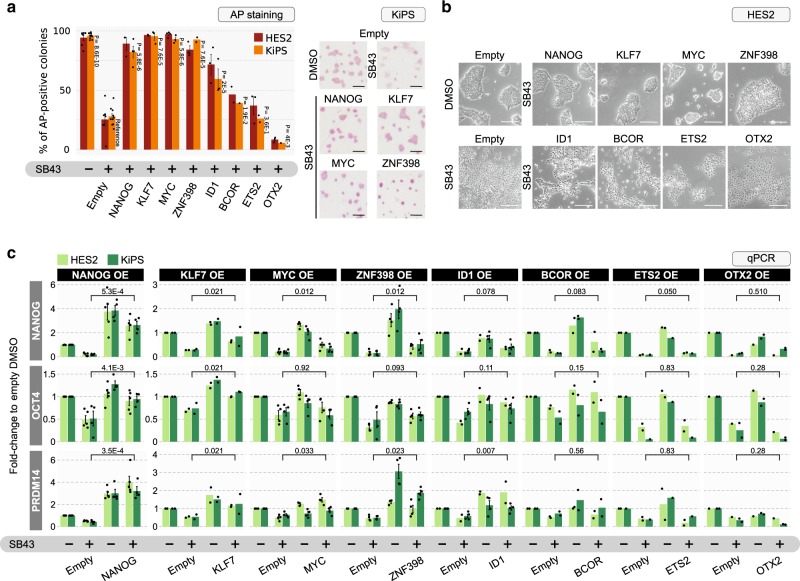
Fig. 3. Functional identification of pluripotency regulators in hPSCs.
a Left: Clonal assay quantification of hESCs (HES2, red bars) and hiPSCs (KiPS, orange bars) stably expressing an empty vector control (Empty) or eight different SMAD3 targets identified in Fig. 2a. Two thousand cells were seeded at clonal density in the presence of DMSO or SB43 and stained for alkaline phosphatase (AP) after 5 days. Bars show the mean ± SEM percentage of AP-positive colonies. Dots represent independent experiments (n = 7, 10 for Empty DMSO; n = 7, 10 for Empty SB43; n = 3, 4 for NANOG SB43; n = 2, 2 for KLF7 SB43; n = 4, 3 for MYC SB43; n = 3, 2 for ZNF398 SB43; n = 3, 3 for ID1 SB43; n = 2, 1 for BCOR SB43; n = 3, 2 for ETS2 SB43; n = 3, 1 for OTX2 SB43 in HES2 and KiPS, respectively). Unpaired two-tailed Mann–Whitney U test relative to Empty SB43 samples. Right: Representative images of clonal assay performed in KiPS. See also Supplementary Fig. 3a for results obtained in H9 hESCs. Scale bars 500 µm. Source data are provided as a Source Data file. b Morphology of HES2 colonies stably expressing an empty vector (Empty) in presence of DMSO or SB43 and HES2 stably expressing the eight SMAD3 targets in presence of SB43. Representative images of three independent experiments are shown. See also Supplementary Fig. 3b for results obtained in H9. Scale bars 200 µm. c Gene expression analysis by qPCR of HES2 (light green bars) and KiPS (dark green bars) stably expressing an Empty vector or the eight SMAD3 targets and treated with or without SB43 for 5 days. Bars indicate mean ± SEM of independent experiments, shown as dots (n = 5, 5 for NANOG overexpression; n = 2, 2 for KLF7 overexpression; n = 4, 4 for MYC overexpression; n = 4, 4 for ZNF398 overexpression, n = 2, 4 for ID1 overexpression; n = 2, 2 for BCOR overexpression; n = 2, 1 for ETS2 overexpression; n = 1, 2 for OTX2 overexpression in HES2 and KiPS, respectively). Expression was normalised to the Empty DMSO samples. Unpaired two-tailed Mann–Whitney U test. Source data are provided as a Source Data file.

