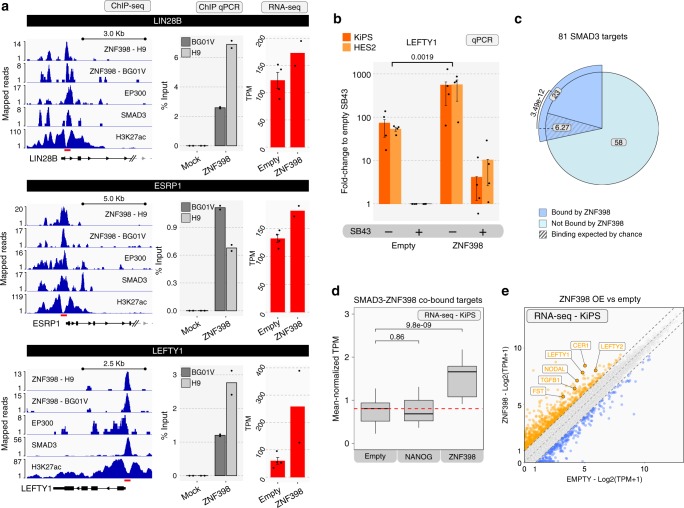
Fig. 7. ZNF398 boosts TGF-beta signal.
a Left: Gene tracks of ZNF398 in two different hPSC lines (H9 and BG01V), EP300, SMAD3, and H3K27ac. Middle: Barcharts of ChIP-qPCR for ZNF398 performed in BG01V (dark grey) and H9 (light grey) cell lines on LIN28B, ESRP1 and LEFTY1 loci. Enrichment is expressed as a percentage of the DNA inputs. Bars indicate the mean of two biological replicates shown as dots. Right: RNA-seq of hPSCs (KiPS) stably expressing an empty vector (Empty) or ZNF398. Bars indicate the mean ± SEM of independent experiments shown as dots (n = 4 and n = 2 in Empty and ZNF398 overexpressing cells, respectively). Absolute expression is reported as TPM. Source data are provided as a Source Data file. b LEFTY1 levels measured by qPCR of HES2 (light orange bars) and KiPS (dark orange bars) stably expressing an empty vector or ZNF398, untreated or treated with SB43 for 5 days. Bars indicate the mean ± SEM of independent experiments shown as dots (n = 4). Expression was normalised to the Empty SB43 samples and shown on a logarithmic scale. Unpaired two-tailed Mann–Whitney U test. Source data are provided as a Source Data file. c Pie-chart representing the 81 SMAD3 direct targets UP-regulated by TGF-beta induction identified in Fig. 1c. In dark blue are shown the 23 SMAD3 targets that are also bound by ZNF398. Such co-binding is significantly higher (p-value = 3.49e−12, Chi-squared test) than the one expected by chance, shown as the slice filled with diagonal lines. d Mean-normalised expression levels of the 23 genes bound by ZNF398 and SMAD3. Shown data derived from RNA-seq analysis of KiPS stably expressing an empty vector, NANOG (serving as a control) or ZNF398. For each gene, data was normalised to the mean-expression across the three samples. Box plot indicates 25th, 50th and 75th percentile; whiskers indicate minimum and maximum. Unpaired two-tailed t-test. e Scatter plot showing RNA-seq data from KiPS stably expressing an empty vector (Empty) or ZNF398. DOWN-regulated (Log2FC < −1) and UP-regulated (Log2FC > 1) genes are indicated in blue and orange respectively.

