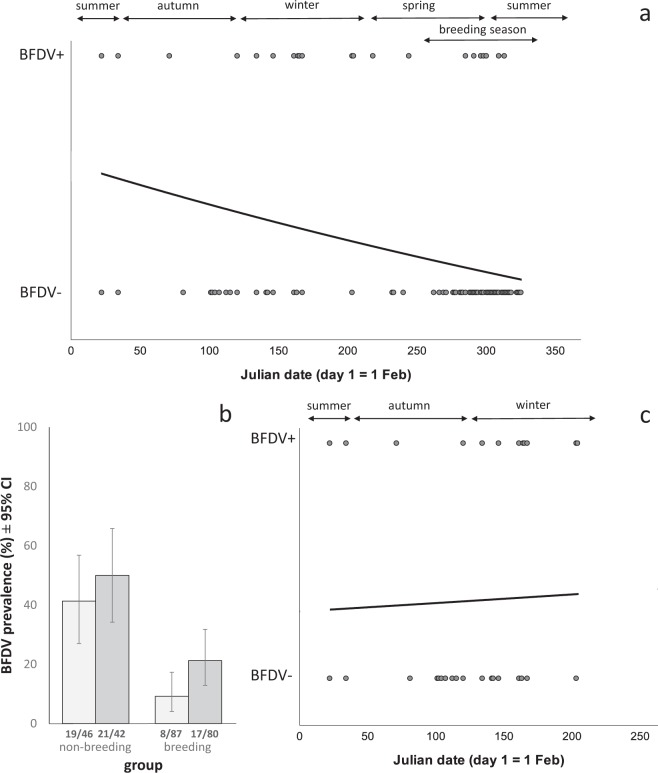
Figure 1.
BFDV prevalence versus (a,c) date and (b) breeding status. ‘BFDV+’ indicates BFDV-positive birds, ‘BFDV−’ indicates BFDV-negative birds. Prevalence versus date is represented as a logistic regression curve. (a) Prevalenceblood of birds caught throughout the year, including outside the breeding season (‘non-breeding’) and during (‘breeding’) the breeding season. (b) Mean prevalence (with 95% confidence intervals) by breeding status, where light grey bars indicate population prevalence of BFDV in blood samples, and dark grey bars indicate population prevalence of BFDV in cloacal swabs. (c) Prevalenceblood for non-breeding birds only. In (a,b) we show only prevalenceblood and not prevalencecloacal, because cloacal swabs were not subject to the same level of validation as blood samples. Date is shown as Julian date, with the 1st February, which marks the end of the breeding season, set as day 1, and so the 31st January is day 365. Fractions at the base of bars indicate the number of infected birds out of the number of trapped individuals. Nine birds which were caught in walk-in traps during the breeding season are not shown in (b,c) as we could not determine whether or not they were breeding.

