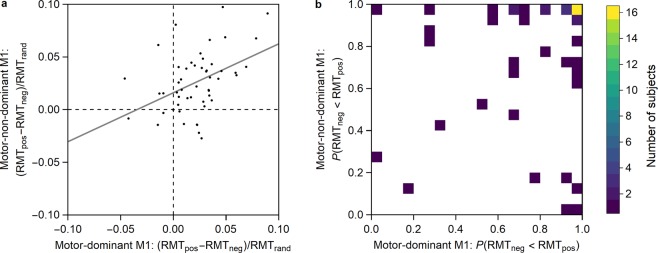
Figure 2.
RMT differences for the motor-dominant and motor-non-dominant M1. (a) Difference in RMT for each subject between the µ-phase positive-peak and negative-peak conditions. The gray line shows a linear fit to the data. For 40/51 of the subjects (78%), either RMTneg < RMTpos (37/51 subjects, 73%) or RMTpos < RMTneg (3/51 subjects, 6%) was observed in both hemispheres, i.e., their data point is either in the upper right or lower left quadrant of the plot, respectively. (b) Number of subjects having a certain probability for RMTneg < RMTpos for the motor-dominant and motor-non-dominant M1. For each subject, the probabilities are obtained from their RMT probability density functions (see Methods, Fig. 3). The number of subjects is reported for adjacent 0.05 × 0.05 squares. The white region marks the area with no subjects.

