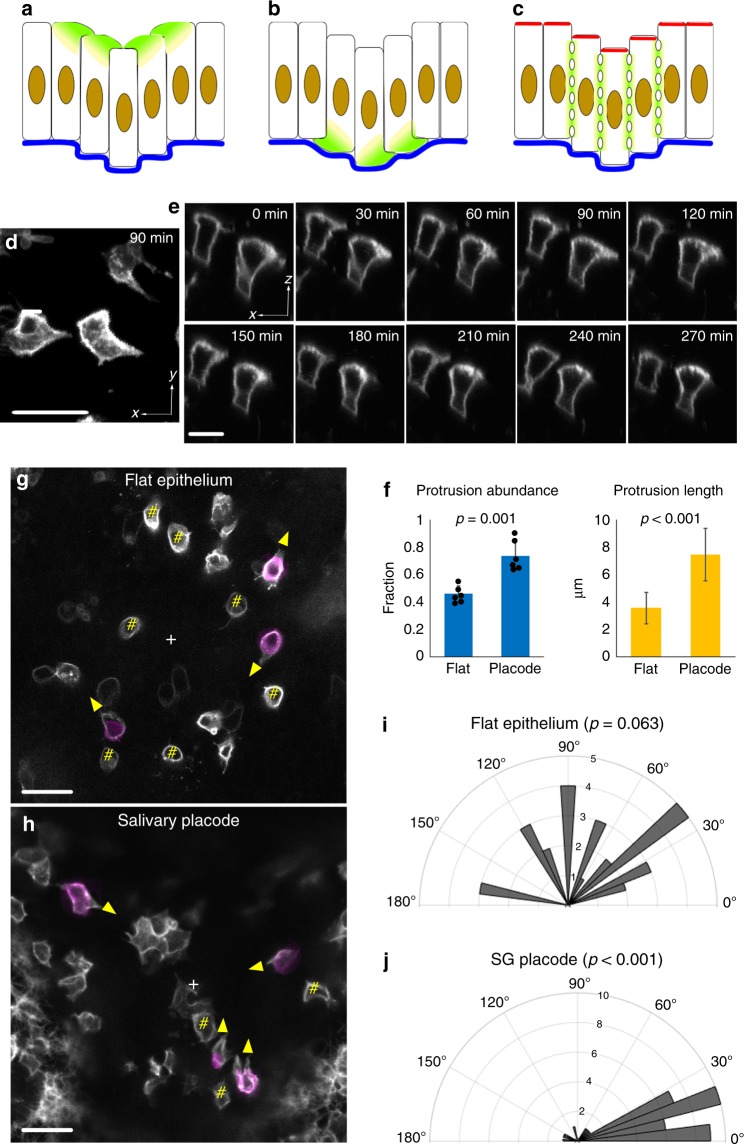
Fig. 3. Centripetal apical protrusions are associated with VT.
a–c Schematics of possible cell behaviour in VT: apical protrusion (a), basal protrusion (b) and lateral undulation (c). d, e, g, h Stills from movies of mosaically labelled epithelia. d Top view of apical protrusions in SG placode from Supplementary Movie 3 (placode centre is to the right). e Side view of apical protrusions from Supplementary Movie 2 (placode centre is to the right). Successive frames show protrusions are dynamic. f Quantifications of the abundance and length of the protrusions. g, h Top view of an area of flat epithelium (g) and SG placode (h) to show the orientation of apical protrusions (grayscale cell contours at the apical end extending beyond magenta-coloured cell contour at mid-height, yellow arrowheads show direction). Hash marks (#) indicate non-protrusive cells. “+” indicates the centre of the microscope field (g) or of the placode (h). To avoid cell shape ambiguity, only isolatedly labelled basal cells were analysed. i, j Quantification of orientation of protrusions (0° indicates protrusion towards field/placode centre). p Values are calculated using the Rayleigh test for circular data (test for non-uniform disribution) and two-tailed unpaired t test for abundance and length data. Sample sizes for f, i and j 3 independent litters, 6 SG placodes, 40 protrusive cells in total, 6 flat regions and 28 cells in total. Bar graphs are means ± SDs. Scale bars: 20 μm. Source data are provided as a Source Data file.

