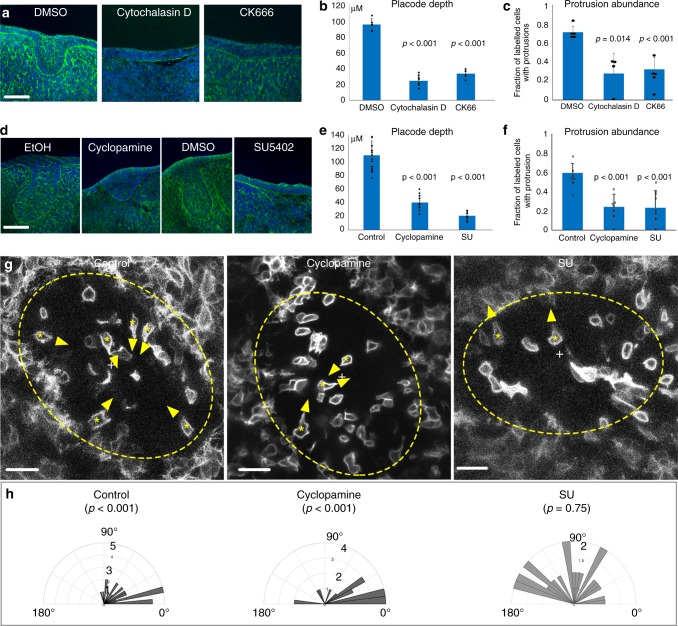
Fig. 4. Protrusions and invagination are similarly sensitive to inhibitors.
a, d Transverse sections of SG placode explant culture with DMSO (vehicle), Cytochalasin D, CK666, ethanol (vehicle), cyclopamine, or SU5402, as indicated (green: phalloidin; blue: DAPI) showing inhibition of invagination. Scale bars: 50 μm. b, c, e, f Quantification of placode depth (b, e) and protrusion abundance (c, f) in inhibitor-treated placodes vs. vehicle-treated controls (means ± SDs, n = 12 placodes, 4 placodes per treatment per experiment from 3 independent litters; n = 100 cells, ~8 per placode). c, f Quantification of by inhibitors compared to controls, g top-view live images of SG placodes in mT/mG explants treated with vehicle, cyclopamine or SU5402. Dashed line circles: placode region. Asterisks inside cells: the cell bodies of protrusive cells. Arrowheads: direction of the protrusion. “+”: the centre of the placode. Note that protrusions are centripetal in control and cyclopamine treated tissues, but not in SU5402-treated tissue. Only isolatedly labelled cells were analysed. Scale bars: 20 μm. h Orientation of protrusions in the three treatments (0° indicates centripetal) (data from three independent litters, six placodes in each condition). p Values in b, c, e, f are from two-tailed unequal variance t tests, in (h) are Rayleigh test. Source data are provided as a Source Data file.

