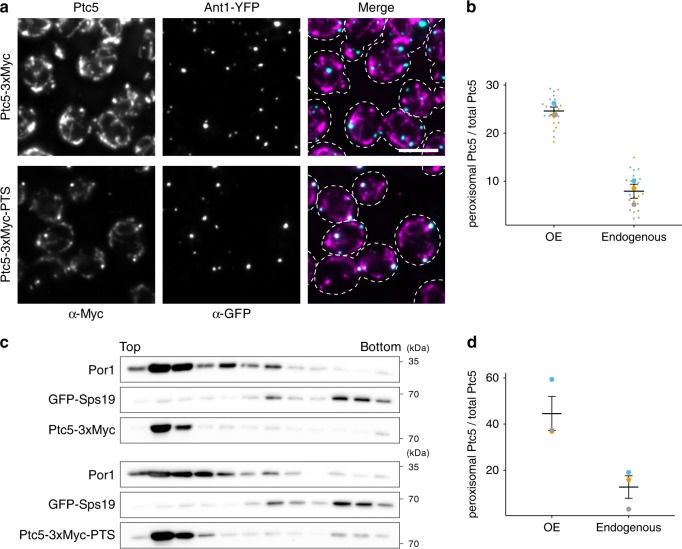
Fig. 2. Dual targeting of endogenously tagged Ptc5.
a Yeast cells expressing either C-terminally (upper panel) or internally (lower panel) 3xMyc tagged Ptc5 (magenta) together with Ant1-YFP (cyan) were analyzed by immunofluorescence microscopy. Antibodies against Myc and GFP were used for detection. White color indicates colocalization in merged pictures. Scale bar represents 5 µm. b The fraction of peroxisomal Ptc5 signal to total Ptc5 signal was quantified using ImageJ59. ‘OE’ indicates Ptc5-RFP-PTS under control of the tef1 promoter (Fig. 1c). ‘Endogenous’ refers to Ptc5-3xMyc-PTS (a). Data of three independent experiments (n = 3; each color represents one experiment) were plotted. Error bars represent standard error of the mean. c Organelles prepared from strains co-expressing either Ptc5-3xMyc (upper three western blots) or Ptc5-3xMyc-PTS (lower three western blots) together with the peroxisomal matrix protein GFP-Sps19 were analyzed by density gradient centrifugation and western blot. Por1 is a protein localized in the outer mitochondrial membrane. Twelve fractions were collected, starting from the top of the gradient, and analyzed. d Western blots from three independent experiments (n = 3; each color represents one experiment) were quantified using ImageJ to determine the ratio of peroxisomal to total Ptc5 signal of Ptc5-RFP-PTS (OE) and Ptc5-3xMyc-PTS (endogenous), respectively. Error bars represent standard error of the mean. Source data are provided in the Source data file.

