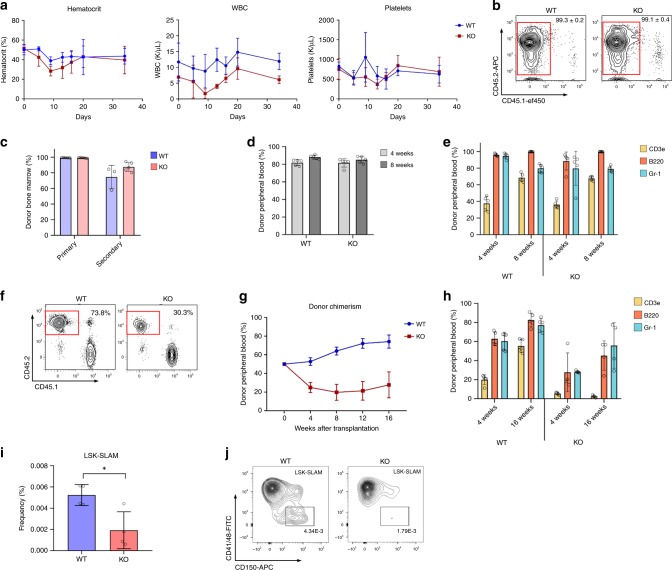
Fig. 4. Loss of Mbnl1 has a modest effect on normal murine hematopoiesis.
a Mbnl1 wild type (WT) and homozygous knockout (KO) mice (five mice per group) were treated with 5-Fluorouracil (150 mg/Kg), and assessed for the levels of hematocrit, WBC, and platelets every 4–5 days. Line graph represents mean ± SD. b Representative density plots show flow cytometry analysis of donor chimerism in bone marrow of primary recipients 12 weeks after non-competitive transplantation (gate overlaid on CD45.2-postive CD45.1-negative donor cells). c Donor chimerism in bone marrow of recipients of primary and secondary transplantation at 12 weeks post-transplant. Bars show mean ± SD (n = 5 mice per group). d Analysis of peripheral blood donor chimerism in primary recipients 12 weeks after non-competitive transplantation. Bars show mean ± SD (n = 5 mice per group). e Flow cytometry analysis of peripheral blood cells presentation in lymphoid (CD3e and B220) and myeloid (GR-1) lineages 4 or 8 weeks after non-competitive transplantation. Bars show mean ± SD (n = 5 mice per group). f Representative density plots show flow cytometry analysis of donor chimerism 12 weeks after competitive transplantation (gating on CD45.2-postive CD45.1-negative donor cells). g Graph represents peripheral blood donor chimerism after competitive transplantation over time (horizontal axis). Line graph represents mean ± SD (n = 5 mice per group). h Flow cytometry analysis of peripheral blood cells representation in lymphoid and myeloid lineages 4 or 16 weeks after competitive transplantation. Bars show mean ± SD (n = 5 mice per group). i LSK-SLAM + population in Mbnl1 WT vs KO mice, represented as fraction of all analyzed cells. (n = 4 mice per group.) *p = 0.0161 by unpaired two-tailed t-test; error bars indicate mean ± SD. j Representative flow plots of LSK-SLAM + quantitation between experimental groups.

