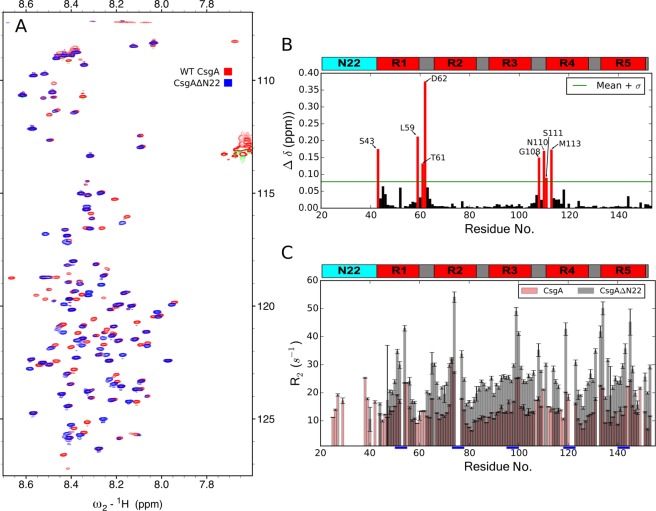
Figure 4.
Truncation of the N22 region shifts dynamics in key amyloidogenic regions. (A) Overlay of 15N-1 H HSQC spectra of CsgA (red) and CsgAΔN22 (blue) highlights widespread CSPs. (B) Mapping of these CSPs to the sequence reveals two prominent clusters that are proximal to key gate-keeper residues. The threshold (green line) for selection of most significant shifts (Δ δ) was calculated as the mean of all CSPs plus the standard deviation. (C) Transverse relaxation rates are elevated across the sequence of the truncation. The highest relaxation rates in both truncate and full-length are noted proximal to prion-like repeats (underlined blue). Error bars represent the estimated errors from fitting exponential decay from experiments performed in triplicate. Bar plots are transparently overlapped according to colouring in the legend to illustrate elevated relaxation in CsgAΔN22.

