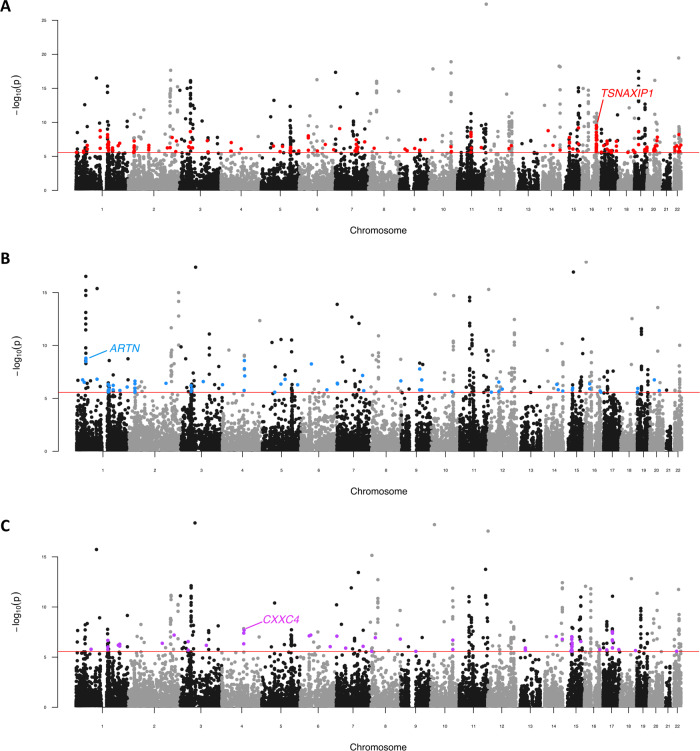
Fig. 4. Pairwise genic meta-analysis of schizophrenia and other psychiatric disorders.
Manhattan plot for each meta-analysis which displays the −log10-transformed P value for association for genes which were tagged by at least one SNP in the respective GWAS. The red line represents the Bonferroni threshold for multiple-testing correction (P < 2.7 × 10⁻⁶). Genes highlighted on each plot were not Bonferroni significant in the individual GWAS but obtained corrected significance in the meta-analysis, with the most significant of these genes labelled for each plot. a Schizophrenia (SZ) and bipolar disorder (BIP) genic meta-analysis, b Schizophrenia and attention-deficit/hyperactivity disorder (ADHD) genic meta-analysis. c Schizophrenia and autism-spectrum disorder (ASD) genic meta-analysis. Manhattan plots for the meta-analyses with MDD, TS, ED and OCD are presented in Supplementary Fig. 1.

