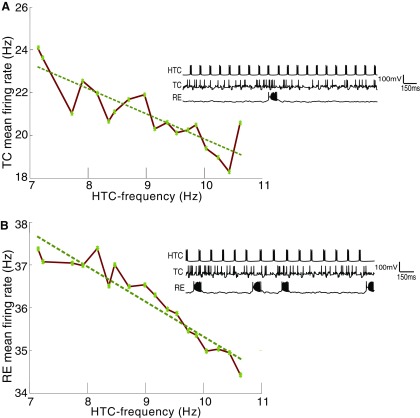
Figure 7.
Increase in inhibitory activity follows a reduction in the firing rate of HTC cells. A, There is an inverse relationship between HTC and TC firing. Lower drive from HTCs releases the inhibitory drive (via interneurons) on the TC cells causing an increase in their activity. Inset shows the time series of HTC, TC, and RE activity corresponding to a normal rhythm (10-Hz HTC frequency, gH = 0.36 mS/cm2). B, Inverse relationship between HTC firing and RE firing. Increased activity of the TC cells leads to enhanced RE activity. Inset shows the time series of HTC, TC, and RE activity corresponding to lowered HTC activity of 7.5 Hz due to reduced HCN expression (gH = 0.28 mS/cm2).

