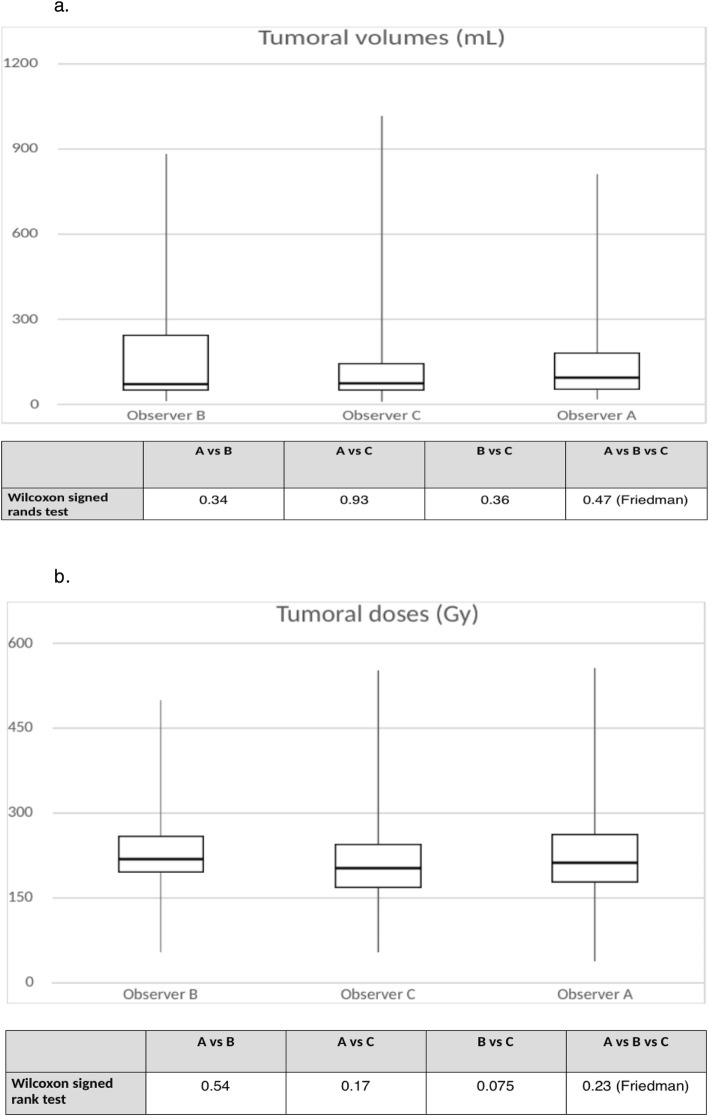
Fig. 3.
a Box plots for tumoral volumes and p values from Wilcoxon signed-rank and Friedman tests. The volume in milliliters is plotted on the y-axis, and the observer is plotted on the x-axis. Upper horizontal line of box represents the 75th percentile; lower horizontal line of the box, 25th percentile; horizontal bar within box, median; upper extremity of line outside the box, maximum value; and lower extremity of line outside the box, minimum value. b Box plots for tumoral doses and p values from Wilcoxon signed-rank and Friedman tests. The dose in grays is plotted on the y-axis, and the observer is plotted on the x-axis. Upper horizontal line of box represents the 75th percentile; lower horizontal line of the box, 25th percentile; horizontal bar within box, median; upper extremity of line outside the box, maximum value; and lower extremity of line outside the box, minimum value

