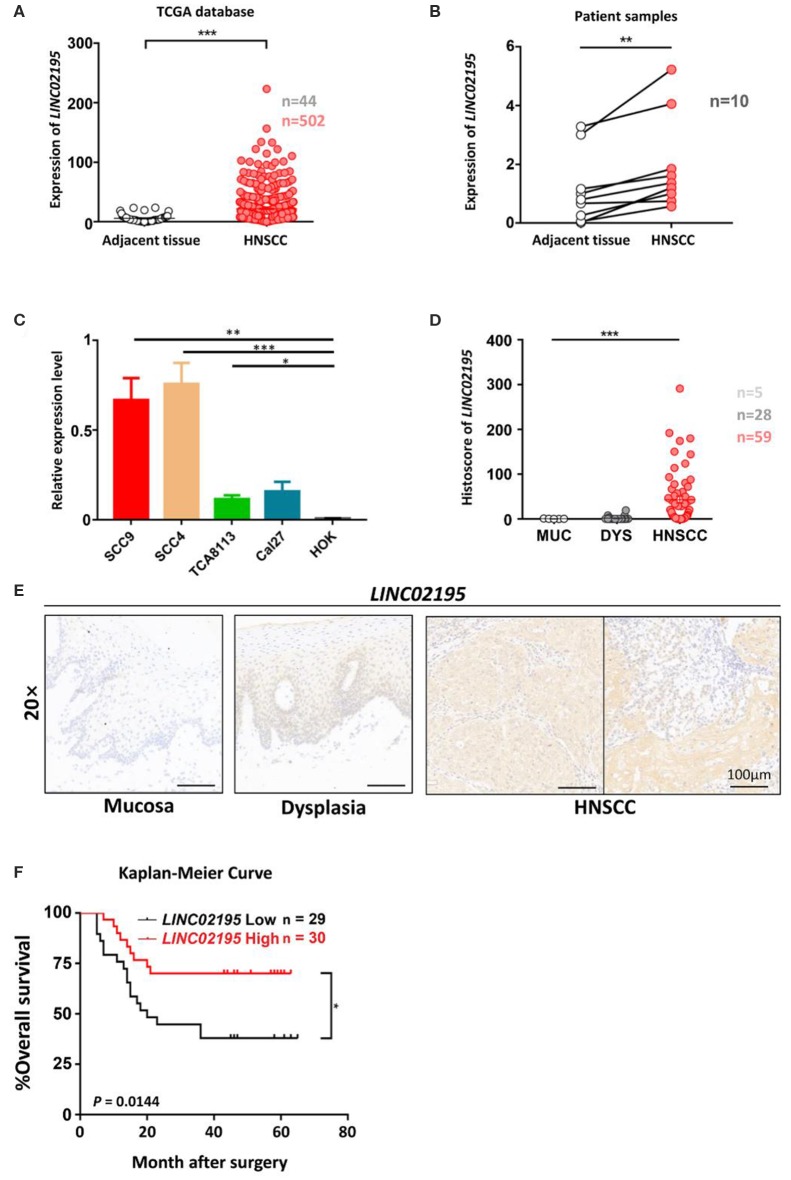
Figure 2.
LINC02195 was expressed at high levels in HNSCC tissues. (A) Relative expression level of LINC02195 in HNSCC and adjacent tissues from TCGA database. ***P < 0.001. (B) Relative expression level of LINC02195 in HNSCC and adjacent tissue samples from patients with HNSCC. **P < 0.01. (C) Relative expression level of LINC02195 in 5 HNSCC cell lines (SCC9, SCC4, TCA8113, CAL27) and HOKs. *P < 0.05, **P < 0.01, and ***P < 0.001. (D–E) Statistical analysis (F) and representative images (E) of ISH using the probe for LINC02195 in normal mucosal, dysplastic and tumor tissues. Scale bar, 100 μm. (F) Kaplan-Meier curve of patients stratified according to low and high expression of LINC02195 in the cohort of the TMA. The median expression was used as the cut-off; P = 0.0144.

